Principales variables de Magnitudes económicas por sector económico (NACE)
ESTADÍSTICA ANUAL
PRINCIPALES VARIABLES
Magnitudes económicas
Principales variables de Magnitudes económicas por sector económico (NACE)
Ejercicio 2011
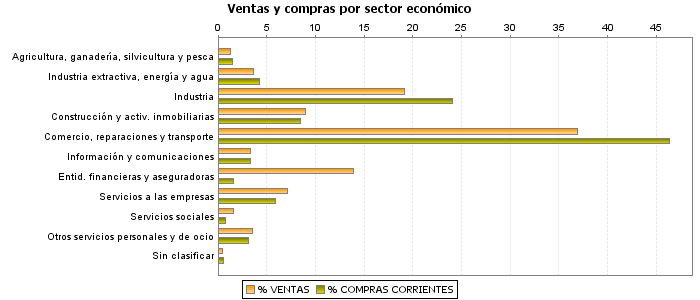
| VENTAS | COMPRAS CORRIENTES |
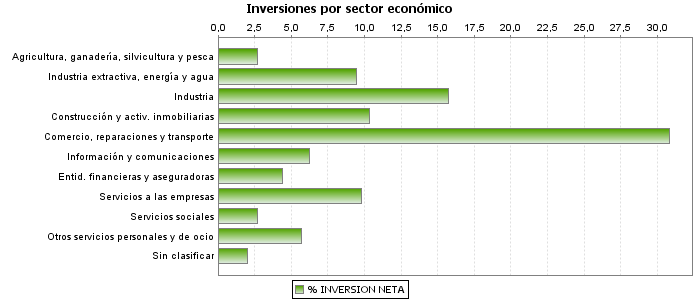
INVERSIÓN NETA |
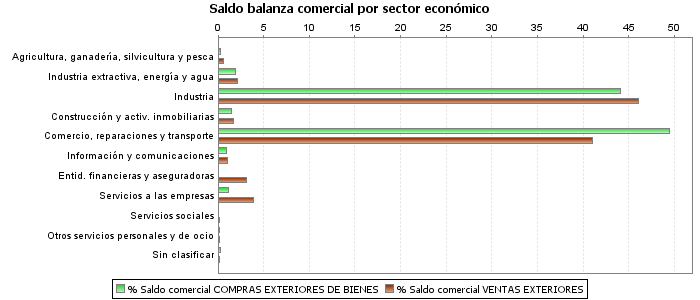
SALDO BALANZA COMERCIAL | VENTAS SUJETAS (%) |
|||||||
|---|---|---|---|---|---|---|---|---|---|---|---|
| Compras exteriores de bienes |
Ventas exteriores | ||||||||||
| Importes | % | Importes | % | Importes | % | Importes | % | Importes | % | ||
| Total | 2.111.397.154 | 100,00 | 1.425.316.115 | 100,00 | 46.183.865 | 100,00 | 287.852.534 | 100,00 | 280.763.426 | 100,00 | 69,94 |
| Agricultura, ganadería, silvicultura y pesca | 26.426.523 | 1,25 | 20.972.601 | 1,47 | 1.259.963 | 2,73 | 875.035 | 0,30 | 1.545.413 | 0,55 | 93,29 |
| Industria extractiva, energía y agua | 77.805.830 | 3,69 | 60.429.595 | 4,24 | 4.377.179 | 9,48 | 5.614.434 | 1,95 | 5.891.680 | 2,10 | 90,75 |
| Industria | 404.991.643 | 19,18 | 343.035.391 | 24,07 | 7.285.521 | 15,78 | 127.021.356 | 44,13 | 129.333.309 | 46,06 | 67,12 |
| Construcción y activ. inmobiliarias | 190.788.358 | 9,04 | 120.765.827 | 8,47 | 4.790.963 | 10,37 | 4.329.449 | 1,50 | 4.739.932 | 1,69 | 94,03 |
| Comercio, reparaciones y transporte | 779.075.379 | 36,90 | 660.712.290 | 46,36 | 14.239.685 | 30,83 | 142.379.746 | 49,46 | 115.091.845 | 40,99 | 83,45 |
| Información y comunicaciones | 70.329.706 | 3,33 | 48.022.117 | 3,37 | 2.875.797 | 6,23 | 2.744.587 | 0,95 | 3.062.823 | 1,09 | 94,59 |
| Entid. financieras y aseguradoras | 293.391.416 | 13,90 | 22.907.399 | 1,61 | 2.028.129 | 4,39 | 172.239 | 0,06 | 8.766.155 | 3,12 | 5,08 |
| Servicios a las empresas | 150.882.446 | 7,15 | 84.776.272 | 5,95 | 4.519.886 | 9,79 | 3.187.301 | 1,11 | 10.876.462 | 3,87 | 84,50 |
| Servicios sociales | 33.022.793 | 1,56 | 10.765.755 | 0,76 | 1.237.316 | 2,68 | 131.852 | 0,05 | 450.944 | 0,16 | 30,07 |
| Otros servicios personales y de ocio | 75.335.417 | 3,57 | 45.020.491 | 3,16 | 2.634.114 | 5,70 | 476.153 | 0,17 | 452.552 | 0,16 | 82,13 |
| Sin clasificar | 9.347.643 | 0,44 | 7.908.377 | 0,55 | 935.314 | 2,03 | 920.381 | 0,32 | 552.310 | 0,20 | 74,00 |
Notas
Unidad: miles de euros
Compras exteriores de bienes: Importaciones a terceros, Adquisiciones intracomunitarias de bienes, Operaciones asimiladas a la importación (MDUA+AICT+BI)
Ventas exteriores: Exportaciones y Entregas intracomunitarias (X+EI)
Ventas sujetas (%)= Ventas sujetas entre ventas totales (VS/VT), siendo ventas sujetas, las ventas totales menos ventas exteriores menos ventas exentas sin dcho. a deducción (VS= VT-VED-VESDF)
Notas
Unidad gráficos: millones de euros