Principales variables de Magnitudes económicas por sector económico (NACE)
ESTADÍSTICA ANUAL
PRINCIPALES VARIABLES
Magnitudes económicas
Principales variables de Magnitudes económicas por sector económico (NACE)
Ejercicio 2012
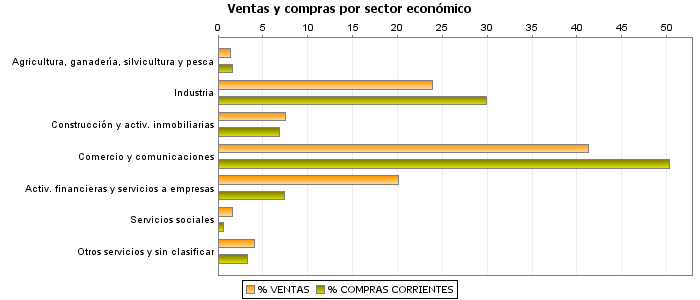
| VENTAS | COMPRAS CORRIENTES |
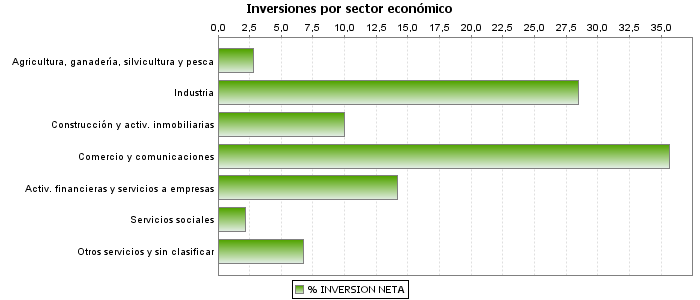
INVERSIÓN NETA |
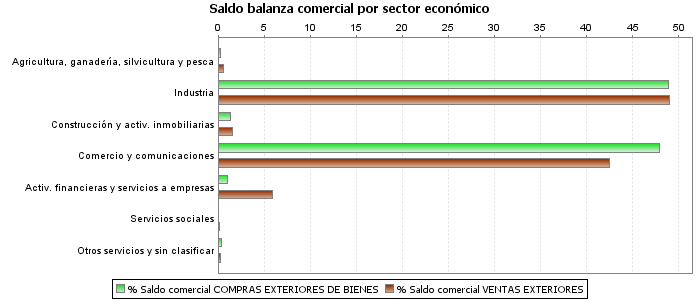
SALDO BALANZA COMERCIAL | VENTAS SUJETAS (%) |
|||||||
|---|---|---|---|---|---|---|---|---|---|---|---|
| Compras exteriores de bienes |
Ventas exteriores | ||||||||||
| Importes | % | Importes | % | Importes | % | Importes | % | Importes | % | ||
| Total | 1.995.872.092 | 100,00 | 1.345.072.365 | 100,00 | 43.023.502 | 100,00 | 285.870.525 | 100,00 | 293.109.160 | 100,00 | 69,02 |
| Agricultura, ganadería, silvicultura y pesca | 27.402.685 | 1,37 | 21.596.016 | 1,61 | 1.191.090 | 2,77 | 798.443 | 0,28 | 1.789.224 | 0,61 | 92,52 |
| Industria extractiva, energía y agua | 80.935.475 | 4,06 | 61.835.068 | 4,60 | 2.650.250 | 6,16 | 5.664.996 | 1,98 | 5.842.948 | 1,99 | 90,91 |
| Industria | 396.214.808 | 19,85 | 341.130.571 | 25,36 | 9.598.948 | 22,31 | 134.079.356 | 46,90 | 137.801.250 | 47,01 | 64,07 |
| Construcción y activ. inmobiliarias | 151.255.434 | 7,58 | 92.079.514 | 6,85 | 4.284.061 | 9,96 | 3.955.485 | 1,38 | 4.510.823 | 1,54 | 92,93 |
| Comercio, reparaciones y transporte | 757.310.383 | 37,94 | 628.691.442 | 46,74 | 12.713.927 | 29,55 | 133.692.219 | 46,77 | 121.417.704 | 41,42 | 81,95 |
| Información y comunicaciones | 67.945.081 | 3,40 | 48.116.977 | 3,58 | 2.627.944 | 6,11 | 3.455.410 | 1,21 | 3.263.648 | 1,11 | 93,36 |
| Entid. financieras y aseguradoras | 266.553.173 | 13,36 | 21.301.306 | 1,58 | 2.258.396 | 5,25 | 184.201 | 0,06 | 6.298.669 | 2,15 | 5,40 |
| Servicios a las empresas | 134.946.111 | 6,76 | 77.919.969 | 5,79 | 3.856.701 | 8,96 | 2.854.015 | 1,00 | 11.168.317 | 3,81 | 88,17 |
| Servicios sociales | 31.496.541 | 1,58 | 8.899.891 | 0,66 | 949.526 | 2,21 | 131.977 | 0,05 | 343.618 | 0,12 | 30,05 |
| Otros servicios personales y de ocio | 74.668.040 | 3,74 | 37.332.738 | 2,78 | 2.088.770 | 4,85 | 468.097 | 0,16 | 488.343 | 0,17 | 78,47 |
| Sin clasificar | 7.144.361 | 0,36 | 6.168.873 | 0,46 | 803.888 | 1,87 | 586.326 | 0,21 | 184.616 | 0,06 | 80,47 |
Notas
Unidad: miles de euros
Compras exteriores de bienes: Importaciones a terceros, Adquisiciones intracomunitarias de bienes, Operaciones asimiladas a la importación (MDUA+AICT+BI)
Ventas exteriores: Exportaciones y Entregas intracomunitarias (X+EI)
Ventas sujetas (%)= Ventas sujetas entre ventas totales (VS/VT), siendo ventas sujetas, las ventas totales menos ventas exteriores menos ventas exentas sin dcho. a deducción (VS= VT-VED-VESDF)
Notas
Unidad gráficos: millones de euros