Principales variables de Magnitudes económicas por sector económico (NACE)
ESTADÍSTICA ANUAL
PRINCIPALES VARIABLES
Magnitudes económicas
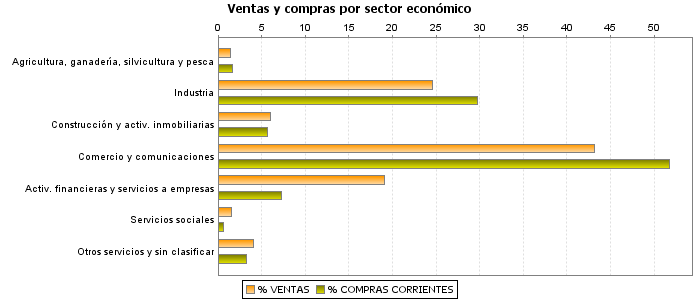
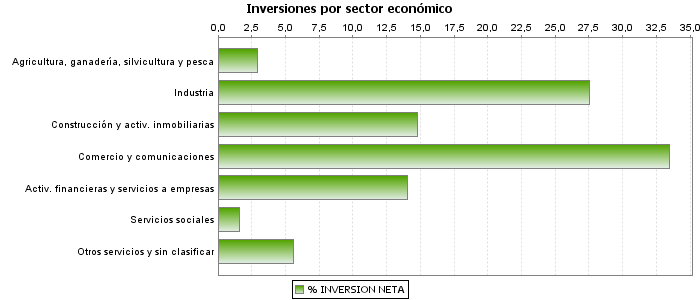
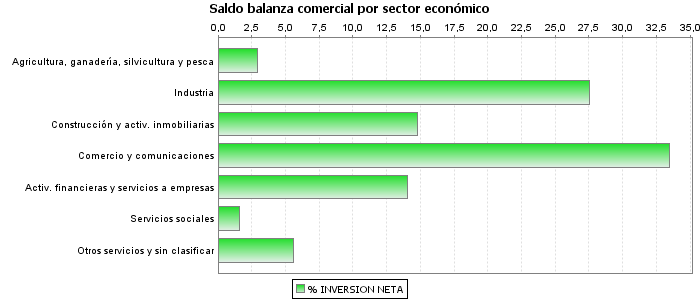
Principales variables de Magnitudes económicas por sector económico (NACE)
Ejercicio 2013
| VENTAS | COMPRAS CORRIENTES |
INVERSIÓN NETA |
SALDO BALANZA COMERCIAL | VENTAS SUJETAS (%) |
|||||||
|---|---|---|---|---|---|---|---|---|---|---|---|
| Compras exteriores de bienes |
Ventas exteriores | ||||||||||
| Importes | % | Importes | % | Importes | % | Importes | % | Importes | % | ||
| Total | 1.947.115.612 | 100,00 | 1.300.368.138 | 100,00 | 42.174.876 | 100,00 | 278.401.439 | 100,00 | 304.737.325 | 100,00 | 68,37 |
| Agricultura, ganadería, silvicultura y pesca | 27.913.913 | 1,43 | 21.691.538 | 1,67 | 1.246.457 | 2,96 | 665.806 | 0,24 | 1.903.004 | 0,62 | 92,12 |
| Industria extractiva, energía y agua | 82.324.552 | 4,23 | 56.489.654 | 4,34 | 1.559.737 | 3,70 | 4.432.996 | 1,59 | 6.915.560 | 2,27 | 89,51 |
| Industria | 397.066.485 | 20,39 | 330.300.994 | 25,40 | 10.047.670 | 23,82 | 126.111.478 | 45,30 | 137.329.109 | 45,06 | 63,42 |
| Construcción y activ. inmobiliarias | 117.976.672 | 6,06 | 73.356.923 | 5,64 | 6.231.116 | 14,77 | 3.970.813 | 1,43 | 6.178.736 | 2,03 | 88,44 |
| Comercio, reparaciones y transporte | 774.451.677 | 39,77 | 627.811.199 | 48,28 | 11.747.585 | 27,85 | 135.685.657 | 48,74 | 131.458.582 | 43,14 | 80,58 |
| Información y comunicaciones | 65.718.866 | 3,38 | 45.317.456 | 3,48 | 2.368.643 | 5,62 | 3.326.008 | 1,19 | 3.010.661 | 0,99 | 94,04 |
| Entid. financieras y aseguradoras | 237.091.798 | 12,18 | 20.165.442 | 1,55 | 2.075.431 | 4,92 | 190.286 | 0,07 | 4.700.148 | 1,54 | 5,75 |
| Servicios a las empresas | 133.718.364 | 6,87 | 74.477.164 | 5,73 | 3.859.223 | 9,15 | 2.921.816 | 1,05 | 12.254.158 | 4,02 | 86,25 |
| Servicios sociales | 31.105.121 | 1,60 | 8.387.793 | 0,65 | 667.079 | 1,58 | 115.177 | 0,04 | 315.791 | 0,10 | 29,40 |
| Otros servicios personales y de ocio | 72.993.470 | 3,75 | 36.861.521 | 2,83 | 1.927.038 | 4,57 | 448.798 | 0,16 | 468.181 | 0,15 | 79,00 |
| Sin clasificar | 6.754.695 | 0,35 | 5.508.455 | 0,42 | 444.897 | 1,05 | 532.605 | 0,19 | 203.394 | 0,07 | 81,68 |
Notas
Unidad: miles de euros
Compras exteriores de bienes: Importaciones a terceros, Adquisiciones intracomunitarias de bienes, Operaciones asimiladas a la importación (MDUA+AICT+BI)
Ventas exteriores: Exportaciones y Entregas intracomunitarias (X+EI)
Ventas sujetas (%)= Ventas sujetas entre ventas totales (VS/VT), siendo ventas sujetas, las ventas totales menos ventas exteriores menos ventas exentas sin dcho. a deducción (VS= VT-VED-VESDF)
Notas
Unidad gráficos: porcentaje