Principales variables de Magnitudes económicas por sector económico (NACE)
ESTADÍSTICA ANUAL
PRINCIPALES VARIABLES
Magnitudes económicas
Principales variables de Magnitudes económicas por sector económico (NACE)
Ejercicio 2014
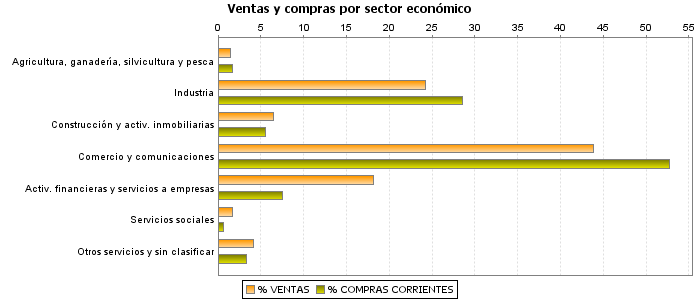
| VENTAS | COMPRAS CORRIENTES |
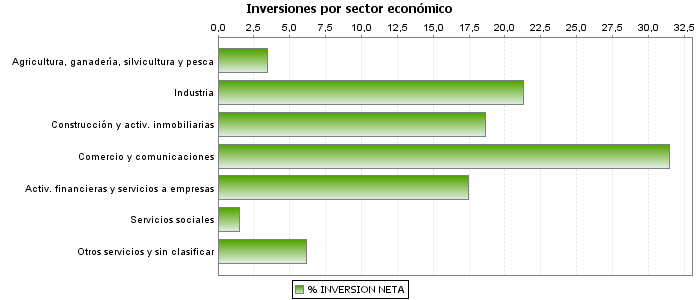
INVERSIÓN NETA |
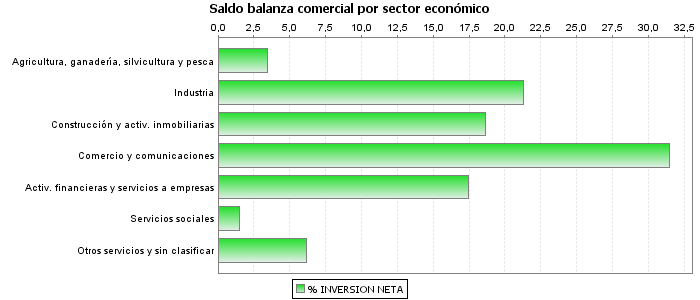
SALDO BALANZA COMERCIAL | VENTAS SUJETAS (%) |
|||||||
|---|---|---|---|---|---|---|---|---|---|---|---|
| Compras exteriores de bienes |
Ventas exteriores | ||||||||||
| Importes | % | Importes | % | Importes | % | Importes | % | Importes | % | ||
| Total | 2.003.344.277 | 100,00 | 1.351.121.535 | 100,00 | 40.671.788 | 100,00 | 295.420.912 | 100,00 | 321.655.092 | 100,00 | 68,89 |
| Agricultura, ganadería, silvicultura y pesca | 29.305.360 | 1,46 | 22.572.355 | 1,67 | 1.414.287 | 3,48 | 774.420 | 0,26 | 1.999.083 | 0,62 | 92,03 |
| Industria extractiva, energía y agua | 74.409.088 | 3,71 | 46.035.599 | 3,41 | 968.848 | 2,38 | 3.682.779 | 1,25 | 6.849.614 | 2,13 | 87,31 |
| Industria | 410.249.014 | 20,48 | 339.781.595 | 25,15 | 7.697.078 | 18,92 | 128.056.890 | 43,35 | 140.532.580 | 43,69 | 63,43 |
| Construcción y activ. inmobiliarias | 128.958.826 | 6,44 | 75.159.677 | 5,56 | 7.570.583 | 18,61 | 4.406.533 | 1,49 | 6.662.365 | 2,07 | 88,46 |
| Comercio, reparaciones y transporte | 809.528.253 | 40,41 | 664.639.342 | 49,19 | 8.612.924 | 21,18 | 149.777.737 | 50,70 | 140.026.638 | 43,53 | 80,27 |
| Información y comunicaciones | 69.999.681 | 3,49 | 47.743.845 | 3,53 | 4.182.876 | 10,28 | 3.920.312 | 1,33 | 4.610.154 | 1,43 | 92,01 |
| Entid. financieras y aseguradoras | 221.010.169 | 11,03 | 21.516.187 | 1,59 | 2.777.799 | 6,83 | 262.923 | 0,09 | 4.991.775 | 1,55 | 5,62 |
| Servicios a las empresas | 143.673.363 | 7,17 | 79.886.135 | 5,91 | 4.335.858 | 10,66 | 3.218.333 | 1,09 | 14.349.931 | 4,46 | 84,93 |
| Servicios sociales | 32.942.814 | 1,64 | 8.678.621 | 0,64 | 615.865 | 1,51 | 118.973 | 0,04 | 698.439 | 0,22 | 28,66 |
| Otros servicios personales y de ocio | 76.576.292 | 3,82 | 38.904.586 | 2,88 | 2.098.401 | 5,16 | 568.266 | 0,19 | 640.573 | 0,20 | 79,87 |
| Sin clasificar | 6.691.417 | 0,33 | 6.203.592 | 0,46 | 397.269 | 0,98 | 633.746 | 0,21 | 293.941 | 0,09 | 78,43 |
Notas
Unidad: miles de euros
Compras exteriores de bienes: Importaciones a terceros, Adquisiciones intracomunitarias de bienes, Operaciones asimiladas a la importación (MDUA+AICT+BI)
Ventas exteriores: Exportaciones y Entregas intracomunitarias (X+EI)
Ventas sujetas (%)= Ventas sujetas entre ventas totales (VS/VT), siendo ventas sujetas, las ventas totales menos ventas exteriores menos ventas exentas sin dcho. a deducción (VS= VT-VED-VESDF)
Notas
Unidad gráficos: porcentaje