Principales variables de Magnitudes económicas por sector económico (NACE)
ESTADÍSTICA ANUAL
PRINCIPALES VARIABLES
Magnitudes económicas
Principales variables de Magnitudes económicas por sector económico (NACE)
Ejercicio 2015
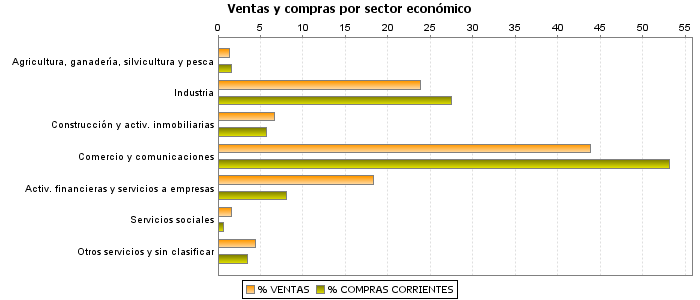
| VENTAS | COMPRAS CORRIENTES |
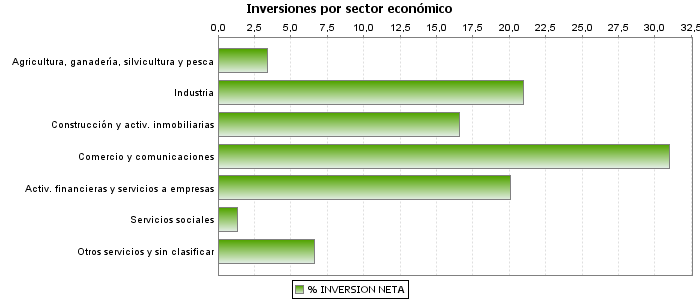
INVERSIÓN NETA |
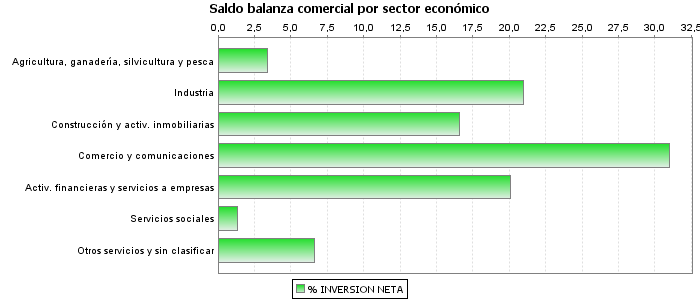
SALDO BALANZA COMERCIAL | VENTAS SUJETAS (%) |
|||||||
|---|---|---|---|---|---|---|---|---|---|---|---|
| Compras exteriores de bienes |
Ventas exteriores | ||||||||||
| Importes | % | Importes | % | Importes | % | Importes | % | Importes | % | ||
| Total | 2.097.271.092 | 100,00 | 1.434.115.603 | 100,00 | 46.764.437 | 100,00 | 313.075.380 | 100,00 | 332.663.741 | 100,00 | 69,69 |
| Agricultura, ganadería, silvicultura y pesca | 28.965.045 | 1,38 | 21.997.020 | 1,53 | 1.575.755 | 3,37 | 690.439 | 0,22 | 1.752.104 | 0,53 | 92,81 |
| Industria extractiva, energía y agua | 68.601.760 | 3,27 | 41.373.427 | 2,88 | 1.352.110 | 2,89 | 2.009.407 | 0,64 | 4.013.665 | 1,21 | 91,83 |
| Industria | 430.858.246 | 20,54 | 352.917.950 | 24,61 | 8.444.442 | 18,06 | 126.411.175 | 40,38 | 148.593.132 | 44,67 | 63,09 |
| Construcción y activ. inmobiliarias | 139.738.222 | 6,66 | 81.320.940 | 5,67 | 7.756.048 | 16,59 | 4.767.725 | 1,52 | 7.442.244 | 2,24 | 87,56 |
| Comercio, reparaciones y transporte | 854.430.935 | 40,74 | 716.332.937 | 49,95 | 11.453.218 | 24,49 | 168.846.205 | 53,93 | 142.611.039 | 42,87 | 80,98 |
| Información y comunicaciones | 64.381.668 | 3,07 | 45.910.780 | 3,20 | 3.042.876 | 6,51 | 2.265.166 | 0,72 | 3.927.446 | 1,18 | 92,80 |
| Entid. financieras y aseguradoras | 216.096.605 | 10,30 | 22.052.668 | 1,54 | 2.971.170 | 6,35 | 263.766 | 0,08 | 4.659.358 | 1,40 | 5,66 |
| Servicios a las empresas | 168.413.166 | 8,03 | 93.584.778 | 6,53 | 6.434.111 | 13,76 | 6.337.690 | 2,02 | 18.017.762 | 5,42 | 84,37 |
| Servicios sociales | 33.804.676 | 1,61 | 9.119.887 | 0,64 | 637.051 | 1,36 | 187.140 | 0,06 | 323.550 | 0,10 | 27,84 |
| Otros servicios personales y de ocio | 85.427.538 | 4,07 | 43.135.716 | 3,01 | 2.735.794 | 5,85 | 650.902 | 0,21 | 923.302 | 0,28 | 80,46 |
| Sin clasificar | 6.553.232 | 0,31 | 6.369.500 | 0,44 | 361.861 | 0,77 | 645.766 | 0,21 | 400.138 | 0,12 | 75,63 |
Notas
Unidad: miles de euros
Compras exteriores de bienes: Importaciones a terceros, Adquisiciones intracomunitarias de bienes, Operaciones asimiladas a la importación (MDUA+AICT+BI)
Ventas exteriores: Exportaciones y Entregas intracomunitarias (X+EI)
Ventas sujetas (%)= Ventas sujetas entre ventas totales (VS/VT), siendo ventas sujetas, las ventas totales menos ventas exteriores menos ventas exentas sin dcho. a deducción (VS= VT-VED-VESDF)
Notas
Unidad gráficos: porcentaje