Principales variables de Magnitudes económicas por sector económico (NACE)
ESTADÍSTICA ANUAL
PRINCIPALES VARIABLES
Magnitudes económicas
Principales variables de Magnitudes económicas por sector económico (NACE)
Ejercicio 2016
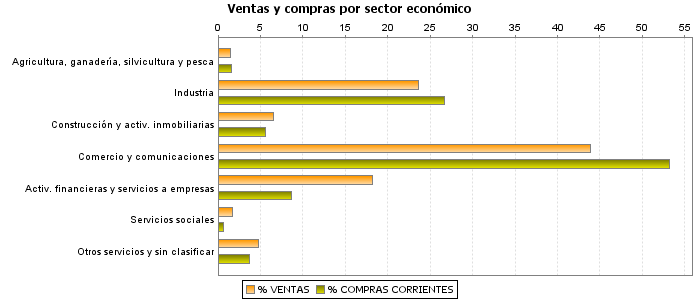
| VENTAS | COMPRAS CORRIENTES |
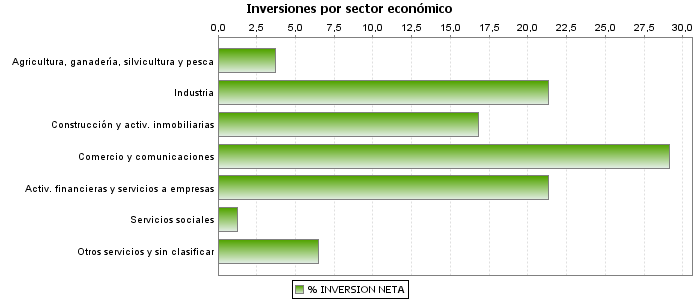
INVERSIÓN NETA |
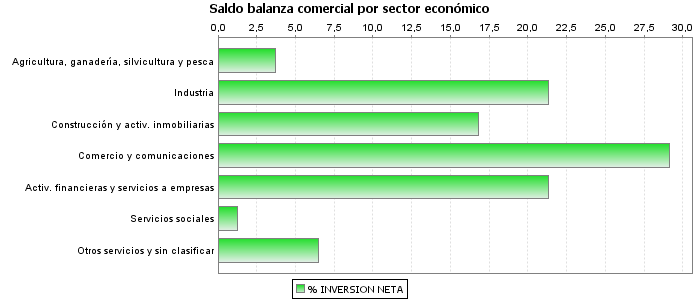
SALDO BALANZA COMERCIAL | VENTAS SUJETAS (%) |
|||||||
|---|---|---|---|---|---|---|---|---|---|---|---|
| Compras exteriores de bienes |
Ventas exteriores | ||||||||||
| Importes | % | Importes | % | Importes | % | Importes | % | Importes | % | ||
| Total | 2.143.137.744 | 100,00 | 1.474.892.507 | 100,00 | 51.285.280 | 100,00 | 317.213.092 | 100,00 | 343.763.843 | 100,00 | 70,71 |
| Agricultura, ganadería, silvicultura y pesca | 31.078.381 | 1,45 | 22.681.200 | 1,54 | 1.891.555 | 3,69 | 730.682 | 0,23 | 2.064.891 | 0,60 | 92,12 |
| Industria extractiva, energía y agua | 62.817.190 | 2,93 | 38.112.495 | 2,58 | 1.940.491 | 3,78 | 2.214.927 | 0,70 | 3.756.297 | 1,09 | 91,70 |
| Industria | 442.478.152 | 20,65 | 355.604.885 | 24,11 | 9.003.351 | 17,56 | 123.598.548 | 38,96 | 149.842.137 | 43,59 | 63,86 |
| Construcción y activ. inmobiliarias | 140.030.956 | 6,53 | 81.854.622 | 5,55 | 8.620.122 | 16,81 | 4.789.659 | 1,51 | 8.091.933 | 2,35 | 88,33 |
| Comercio, reparaciones y transporte | 872.571.810 | 40,71 | 735.656.897 | 49,88 | 11.815.887 | 23,04 | 174.446.405 | 54,99 | 143.522.087 | 41,75 | 81,31 |
| Información y comunicaciones | 67.779.271 | 3,16 | 48.780.025 | 3,31 | 3.122.918 | 6,09 | 2.041.022 | 0,64 | 4.163.074 | 1,21 | 92,78 |
| Entid. financieras y aseguradoras | 213.487.160 | 9,96 | 30.273.861 | 2,05 | 3.959.375 | 7,72 | 425.544 | 0,13 | 10.032.852 | 2,92 | 10,20 |
| Servicios a las empresas | 175.598.147 | 8,19 | 97.731.994 | 6,63 | 6.970.461 | 13,59 | 7.349.512 | 2,32 | 20.326.901 | 5,91 | 83,54 |
| Servicios sociales | 35.582.489 | 1,66 | 9.236.765 | 0,63 | 650.569 | 1,27 | 188.128 | 0,06 | 549.358 | 0,16 | 27,58 |
| Otros servicios personales y de ocio | 93.549.374 | 4,37 | 47.572.996 | 3,23 | 2.950.500 | 5,75 | 812.103 | 0,26 | 958.269 | 0,28 | 81,59 |
| Sin clasificar | 8.164.814 | 0,38 | 7.386.767 | 0,50 | 360.050 | 0,70 | 616.563 | 0,19 | 456.043 | 0,13 | 78,62 |
Notas
Unidad: miles de euros
Compras exteriores de bienes: Importaciones a terceros, Adquisiciones intracomunitarias de bienes, Operaciones asimiladas a la importación (MDUA+AICT+BI)
Ventas exteriores: Exportaciones y Entregas intracomunitarias (X+EI)
Ventas sujetas (%)= Ventas sujetas entre ventas totales (VS/VT), siendo ventas sujetas, las ventas totales menos ventas exteriores menos ventas exentas sin dcho. a deducción (VS= VT-VED-VESDF)
Notas
Unidad gráficos: porcentaje