- 2017

- Resultados económicos IVA
- COMPARATIVA 2014-2017
- Perspectiva global
- Declarantes con resumen-anual
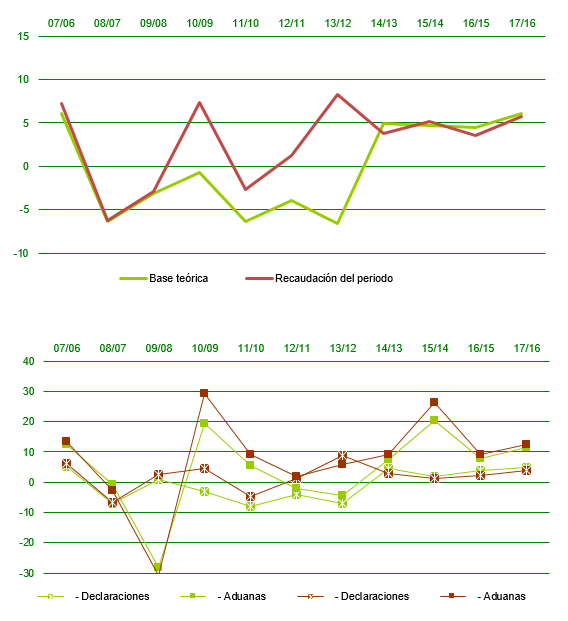
Base teórica, recaudación del período y tipo medio ponderado (declarantes con resumen-anual)
COMPARATIVA 2014-2017
Perspectiva global
Base teórica, recaudación del período y tipo medio ponderado (declarantes con resumen-anual)
Ejercicio 2017
|
2017
|
2016
|
2015
|
2014
|
17/16
|
16/15
|
15/14
|
|
|---|---|---|---|---|---|---|---|
| BASE TEÓRICA | 437.426.285 | 412.228.699 | 394.512.085 | 376.638.133 | 6,11 | 4,49 | 4,75 |
| Declaraciones | 355.210.816 | 338.495.820 | 326.159.563 | 319.850.891 | 4,94 | 3,78 | 1,97 |
| Importaciones | 82.211.463 | 73.725.249 | 68.334.254 | 56.771.864 | 11,51 | 7,89 | 20,37 |
| Importaciones en declaración | 64.846.301 | 54.803.363 | 43.857.160 | 18,33 | 24,96 | ||
| Importaciones en aduanas | 17.365.162 | 18.921.886 | 24.477.095 | -8,23 | -22,70 | ||
| Modelo 380 | 4.006 | 7.629 | 18.268 | 15.378 | -47,49 | ||
| RECAUDACIÓN DEL PERÍODO | 68.471.082 | 64.794.271 | 62.549.971 | 59.473.259 | 5,67 | 3,59 | 5,17 |
| Declaraciones | 53.633.246 | 51.604.858 | 50.446.053 | 49.898.262 | 3,93 | 2,30 | 1,10 |
| Importaciones | 14.836.995 | 13.187.813 | 12.100.090 | 9.572.399 | 12,51 | 8,99 | 26,41 |
| Importaciones en declaración | 11.703.608 | 9.803.185 | 7.765.924 | 19,39 | 26,23 | ||
| Importaciones en aduanas | 3.133.387 | 3.384.629 | 4.334.167 | -7,42 | -21,91 | ||
| Modelo 380 | 840 | 1.600 | 3.829 | 2.599 | -47,50 | ||
| TIPO MEDIO PONDERADO | 15,65 | 15,72 | 15,86 | 15,79 | -0,06 | -0,14 | 0,06 |
| Declaraciones | 15,10 | 15,25 | 15,47 | 15,60 | -0,15 | -0,22 | -0,13 |
| Importaciones | 18,05 | 17,89 | 17,71 | 16,86 | 0,16 | 0,18 | 0,85 |
| Importaciones en declaración | 18,05 | 17,89 | 17,71 | 0,16 | 0,18 | ||
| Importaciones en aduanas | 18,04 | 17,89 | 17,71 | 0,16 | 0,18 | ||
| Modelo 380 | 20,97 | 20,97 | 20,96 | 16,90 |
Notas
Unidad: miles de euros
Evolución de Base teórica y Recaudación del periodo (declarantes con resumen anual)
Notas
Unidad gráficos: porcentaje