Principales variables de Magnitudes económicas por sector económico (NACE)
ESTADÍSTICA ANUAL
PRINCIPALES VARIABLES
Magnitudes económicas
Principales variables de Magnitudes económicas por sector económico (NACE)
Ejercicio 2017
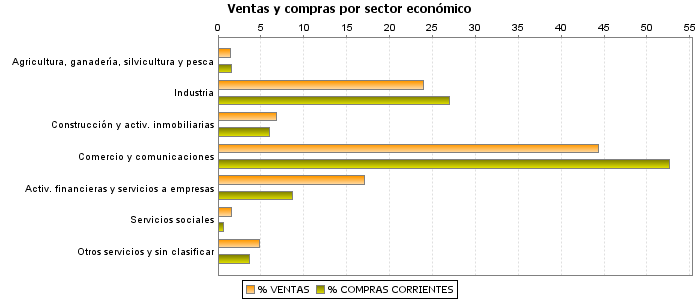
| VENTAS | COMPRAS CORRIENTES |
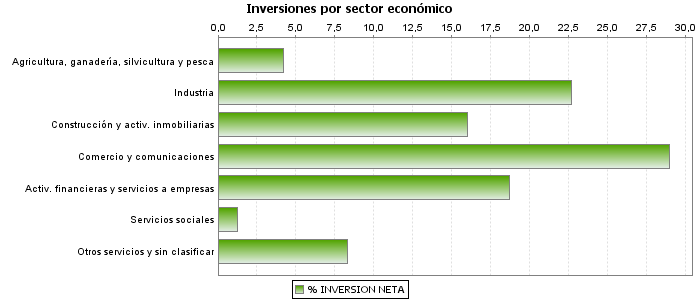
INVERSIÓN NETA |
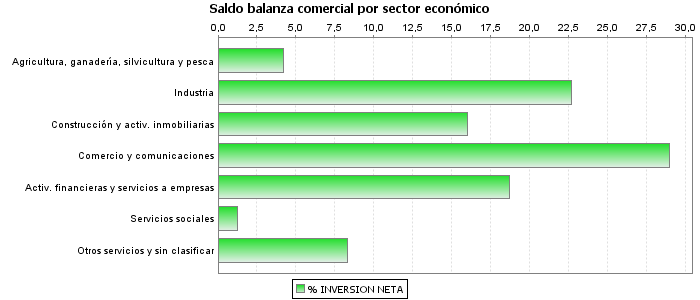
SALDO BALANZA COMERCIAL | VENTAS SUJETAS (%) |
|||||||
|---|---|---|---|---|---|---|---|---|---|---|---|
| Compras exteriores de bienes |
Ventas exteriores | ||||||||||
| Importes | % | Importes | % | Importes | % | Importes | % | Importes | % | ||
| Total | 2.285.840.340 | 100,00 | 1.595.636.845 | 100,00 | 49.918.838 | 100,00 | 347.477.793 | 100,00 | 380.490.855 | 100,00 | 71,70 |
| Agricultura, ganadería, silvicultura y pesca | 33.203.184 | 1,45 | 24.265.193 | 1,52 | 2.080.461 | 4,17 | 834.518 | 0,24 | 1.956.741 | 0,51 | 93,01 |
| Industria extractiva, energía y agua | 67.598.254 | 2,96 | 42.626.626 | 2,67 | 1.758.780 | 3,52 | 3.171.691 | 0,91 | 4.566.836 | 1,20 | 91,75 |
| Industria | 479.623.275 | 20,98 | 387.418.772 | 24,28 | 9.551.256 | 19,13 | 134.724.605 | 38,77 | 165.190.910 | 43,42 | 62,97 |
| Construcción y activ. inmobiliarias | 155.003.207 | 6,78 | 95.731.049 | 6,00 | 7.988.863 | 16,00 | 6.171.659 | 1,78 | 6.999.493 | 1,84 | 90,00 |
| Comercio, reparaciones y transporte | 940.358.658 | 41,14 | 791.423.597 | 49,60 | 11.509.497 | 23,06 | 191.366.287 | 55,07 | 156.538.830 | 41,14 | 81,33 |
| Información y comunicaciones | 72.088.950 | 3,15 | 48.122.489 | 3,02 | 2.936.856 | 5,88 | 1.889.982 | 0,54 | 4.856.898 | 1,28 | 92,37 |
| Entid. financieras y aseguradoras | 205.332.920 | 8,98 | 31.756.252 | 1,99 | 3.110.704 | 6,23 | 348.073 | 0,10 | 17.363.442 | 4,56 | 12,72 |
| Servicios a las empresas | 185.813.555 | 8,13 | 106.377.130 | 6,67 | 6.212.412 | 12,45 | 7.517.627 | 2,16 | 21.361.194 | 5,61 | 85,14 |
| Servicios sociales | 34.947.449 | 1,53 | 9.492.519 | 0,59 | 633.150 | 1,27 | 170.063 | 0,05 | 336.650 | 0,09 | 30,35 |
| Otros servicios personales y de ocio | 101.557.257 | 4,44 | 51.801.576 | 3,25 | 3.946.813 | 7,91 | 849.075 | 0,24 | 996.366 | 0,26 | 82,72 |
| Sin clasificar | 10.313.631 | 0,45 | 6.621.642 | 0,41 | 190.045 | 0,38 | 434.213 | 0,12 | 323.495 | 0,09 | 51,02 |
Notas
Unidad: miles de euros
Compras exteriores de bienes: Importaciones a terceros, Adquisiciones intracomunitarias de bienes, Operaciones asimiladas a la importación (MDUA+AICT+BI)
Ventas exteriores: Exportaciones y Entregas intracomunitarias (X+EI)
Ventas sujetas (%)= Ventas sujetas entre ventas totales (VS/VT), siendo ventas sujetas, las ventas totales menos ventas exteriores menos ventas exentas sin dcho. a deducción (VS= VT-VED-VESDF)
Notas
Unidad gráficos: porcentaje