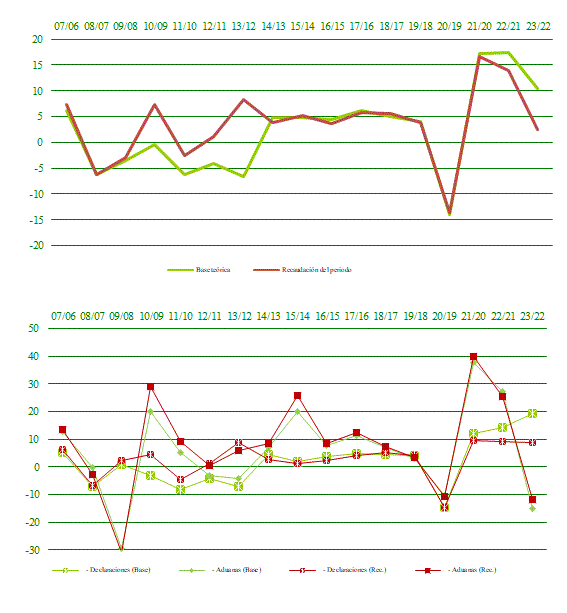
Base teórica, recaudación del período y tipo medio ponderado (total declarantes IVA)
COMPARATIVA 2020-2023
Perspectiva global
Base teórica, recaudación del período y tipo medio ponderado (total declarantes IVA)
Ejercicio 2023|
2023
|
2022
|
2021
|
2020
|
23/22
|
22/21
|
21/20
|
|
|---|---|---|---|---|---|---|---|
| BASE TEÓRICA | 628.286.661 | 569.040.985 | 485.119.019 | 414.211.510 | 10,41 | 17,30 | 17,12 |
| Declaraciones | 502.858.438 | 421.596.270 | 369.212.068 | 329.930.202 | 19,27 | 14,19 | 11,91 |
| Importaciones | 125.426.190 | 147.438.222 | 115.904.019 | 84.280.426 | -14,93 | 27,21 | 37,52 |
| Importaciones en declaración | 99.543.214 | 115.801.129 | 91.587.100 | 65.398.500 | -14,04 | 26,44 | 40,04 |
| Importaciones en aduanas | 25.882.977 | 31.637.093 | 24.316.919 | 18.881.926 | -18,19 | 30,10 | 28,78 |
| Modelo 380 | 2.033 | 6.493 | 2.932 | 882 | |||
| RECAUDACIÓN DEL PERÍODO | 88.924.533 | 86.753.261 | 76.221.493 | 65.385.224 | 2,50 | 13,82 | 16,57 |
| Declaraciones | 65.206.136 | 59.910.444 | 54.804.280 | 50.083.877 | 8,84 | 9,32 | 9,42 |
| Importaciones | 23.717.997 | 26.841.477 | 21.416.599 | 15.301.162 | -11,64 | 25,33 | 39,97 |
| Importaciones en declaración | 18.742.057 | 21.000.674 | 16.867.100 | 11.833.551 | -10,75 | 24,51 | 42,54 |
| Importaciones en aduanas | 4.975.939 | 5.840.803 | 4.549.499 | 3.467.611 | -14,81 | 28,38 | 31,20 |
| Modelo 380 | 401 | 1.340 | 615 | 185 | |||
| TIPO MEDIO PONDERADO | 14,15 | 15,25 | 15,71 | 15,79 | -1,09 | -0,47 | -0,07 |
| Declaraciones | 12,97 | 14,21 | 14,84 | 15,18 | -1,24 | -0,63 | -0,34 |
| Importaciones | 18,91 | 18,21 | 18,48 | 18,16 | 0,70 | -0,27 | 0,32 |
| Importaciones en declaración | 18,83 | 18,14 | 18,42 | 18,09 | 0,69 | -0,28 | 0,32 |
| Importaciones en aduanas | 19,22 | 18,46 | 18,71 | 18,36 | 0,76 | -0,25 | 0,34 |
| Modelo 380 | 19,73 | 20,64 | 20,98 | 20,97 |
Notas
Unidad: miles de euros
Evolución de Base teórica y Recaudación del periodo (total declarantes IVA)
Notas
Unidad gráficos: porcentaje