Principales variables de los componentes de la Base Teórica por sector económico (NACE)
ESTADÍSTICA ANUAL
PRINCIPALES VARIABLES
Componentes Base Teórica
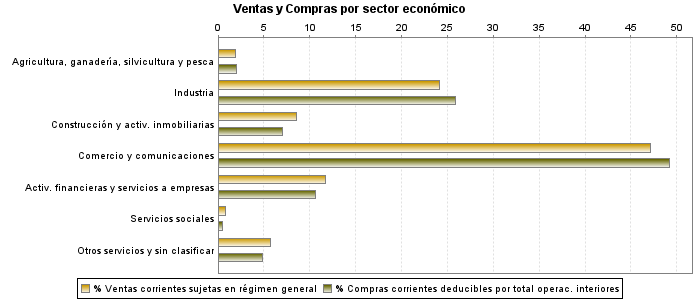
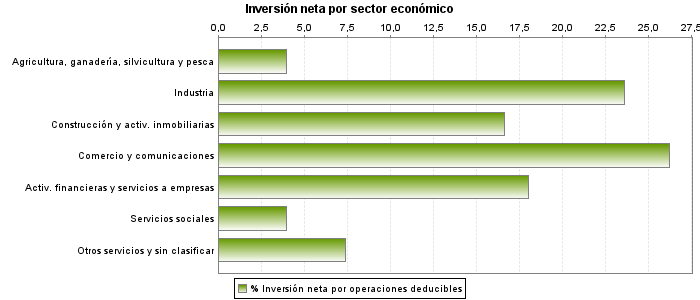
Principales variables de los componentes de la Base Teórica por sector económico (NACE)
Ejercicio 2023| Ventas corrientes sujetas régimen general |
Compras corrientes deducibles total operac. interiores |
Operaciones regímenes especiales |
Inversión neta operaciones deducibles |
|||||
|---|---|---|---|---|---|---|---|---|
| Importes | % | Importes | % | Importes | % | Importes | % | |
| Total | 2.091.975.632 | 100,00 | 1.444.501.585 | 100,00 | 143.643.429 | 100,00 | 60.621.049 | 100,00 |
| Agricultura, ganadería, silvicultura y pesca | 40.490.282 | 1,94 | 29.437.192 | 2,04 | 1.438.995 | 1,00 | 2.416.449 | 3,99 |
| Industria extractiva, energía y agua | 132.195.608 | 6,32 | 89.943.192 | 6,23 | 9.227.878 | 6,42 | 4.330.270 | 7,14 |
| Industria | 373.272.264 | 17,84 | 283.256.302 | 19,61 | 22.049.849 | 15,35 | 10.007.092 | 16,51 |
| Construcción y activ. inmobiliarias | 177.978.707 | 8,51 | 101.464.287 | 7,02 | 44.341.359 | 30,87 | 10.102.241 | 16,66 |
| Comercio, reparaciones y transporte | 905.510.817 | 43,28 | 654.531.079 | 45,31 | 49.095.172 | 34,18 | 12.967.500 | 21,39 |
| Información y comunicaciones | 80.066.798 | 3,83 | 56.030.158 | 3,88 | 2.982.052 | 2,08 | 2.942.575 | 4,85 |
| Entid. financieras y aseguradoras | 36.195.393 | 1,73 | 35.916.556 | 2,49 | 1.241.281 | 0,86 | 4.140.089 | 6,83 |
| Servicios a las empresas | 208.651.589 | 9,97 | 117.877.385 | 8,16 | 7.732.853 | 5,38 | 6.819.683 | 11,25 |
| Servicios sociales | 17.606.989 | 0,84 | 6.645.624 | 0,46 | 1.798.345 | 1,25 | 2.398.579 | 3,96 |
| Otros servicios personales y de ocio | 114.773.984 | 5,49 | 63.115.645 | 4,37 | 3.050.234 | 2,12 | 4.098.912 | 6,76 |
| Sin clasificar | 5.233.201 | 0,25 | 6.284.166 | 0,44 | 685.411 | 0,48 | 397.660 | 0,66 |
Notas
Unidad: miles de euros
Notas
Unidad gráficos: porcentaje