Graphic diagram of the application on the amount of the full quotas of the general and autonomous deductions
The following table schematically represents the application of the general and regional deductions referred to in the 2020 financial year:
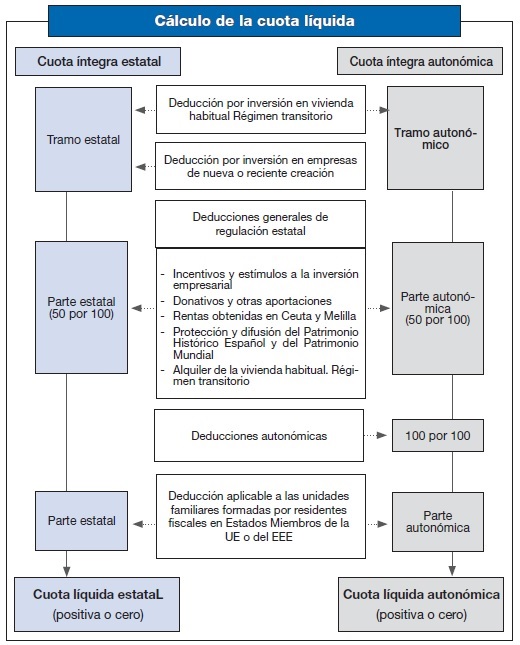
The following table schematically represents the application of the general and regional deductions referred to in the 2020 financial year: