Tax bases
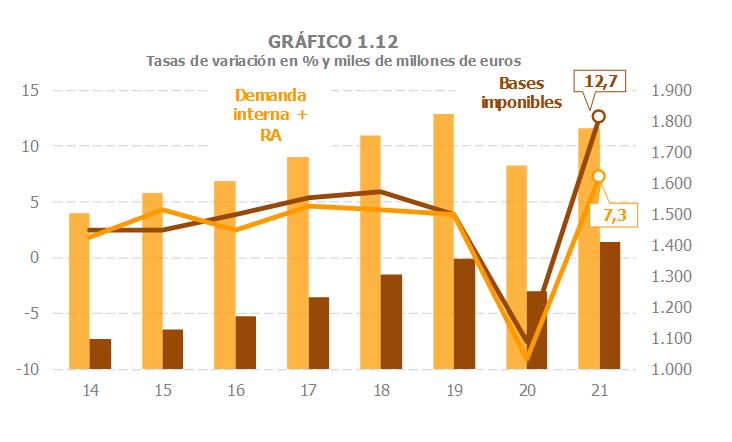
In 2021, the tax bases of the main taxes grew by 12.7%. This growth is greater than the fall that occurred in 2020 (-7.5%), so that at the end of the year the tax bases were 4.2% higher than those recorded in 2019 ( Table 1.3 ). As was the case in 2020, when the decline in the bases was less than that experienced by the macroeconomic indicator usually used as a reference (the sum of domestic demand and employee compensation), in 2021 the bases also showed better performance. In Chart 1.12 it can be seen that while the bases increased compared to 2019, as stated, by 4.2%, the sum of both accounting aggregates decreased (by 2.5%). As then, there are reasons that explain the disparity. In 2020, it was public income, some of which (such as transfers linked to ERTE and aid to the self-employed) are not directly reflected in the indicator. These incomes played the opposite role in 2021, but other bases (such as business profits or the value of energy product consumption), also without immediate translation into the indicator or with less weight in it, acted in favor of the tax bases. However, even in the bases closest to the indicators (spending subject to VAT in the case of domestic demand or salaries in the case of remuneration of employees) the divergences were accentuated in 2021. For example, the wage bill from tax returns, conceptually equivalent to the salaries and wages included in employee remuneration, was 3.1% higher in 2021 than in 2019, while the salaries and wages estimated by the National Accounting System were 0.8% lower in 2021 than in that year.
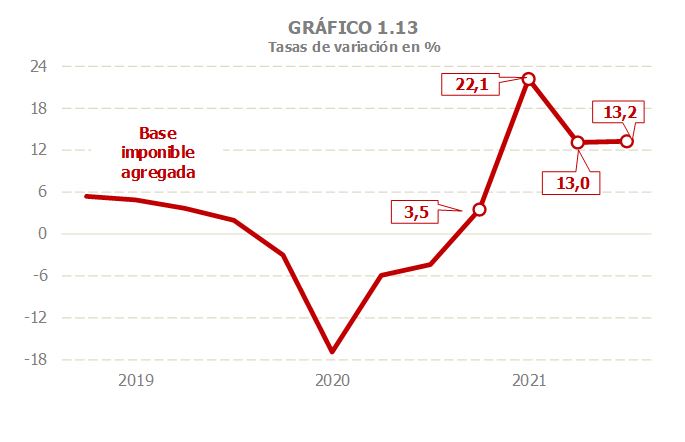
The evolution of the bases throughout the year was, logically, determined by the comparison with what happened in 2020, a year marked by confinement and the different degrees of restrictions on activity and mobility (Chart 1.13). Thus, the year began with moderate growth, conditioned by the effect of the wave of infections at the end of 2020 and beginning of 2021 and by the effect of the Filomena storm, to rebound strongly in the second quarter in response to the sharp drop in activity produced in the months of strictest confinement in 2020 and, subsequently, to remain in the second half of the year at rates slightly above 13%.
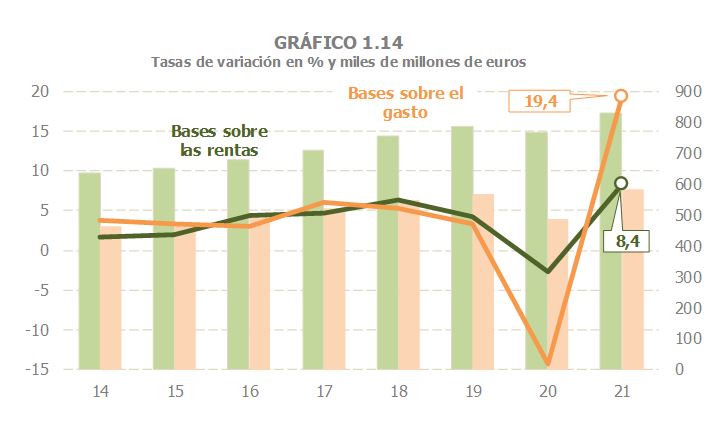
In 2021, the growth of the bases linked to income was less intense than that of those associated with expenditure (8.4% and 19.4%, respectively; Chart 1.14), a reflection, once again, of what happened in 2020, a year in which the effects of the pandemic had a greater impact on the deterioration of spending, while the fall in income was limited by the cushion provided by public income, both wages and pensions as well as other benefits, especially those derived from ERTE and aid to the self-employed. Compared to 2019, incomes exceeded those of that time by 5.4%, while spending was 2.4% higher than two years ago, thanks above all to the strong growth that occurred in the second half (in the first half, spending levels still remained below 2019 levels), favored by the price increases observed in the final stretch of the year.
household income grew by 5.9 in 2021 ( 2.1), with an improvement in all its components, an improvement that was, logically, more intense in income from the private sector (wages, capital income and business income), which performed worse last year (Chart ). Public revenues, on the other hand, in 2020 allowed the decline in household income to be halted and in 2021 they practically maintained the level of a year earlier. Overall, compared to 2019, rents were 5.5% higher than then. Except for income from capital assets and income from the leasing of premises, the rest of the income remained above the 2019 level.
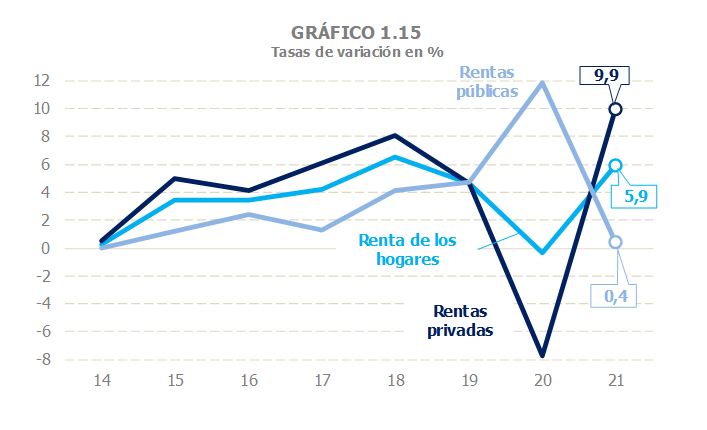
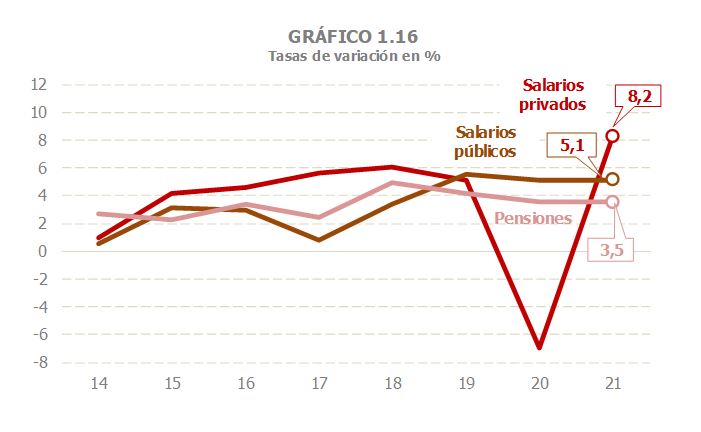
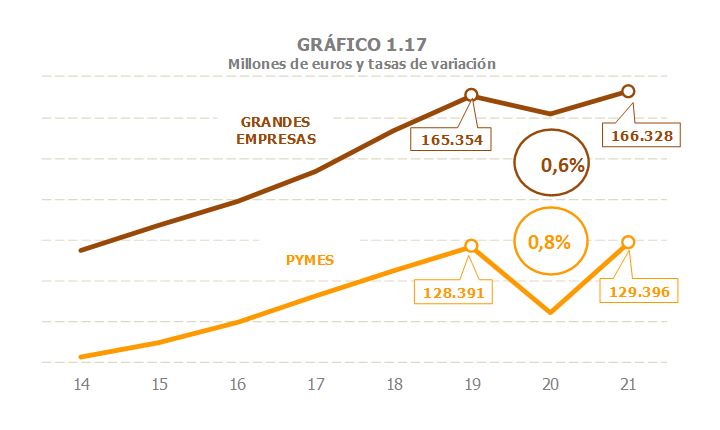
Labor income, the main component of household income, grew by 4.3% ( Table 2.1 ). The divergence between the performance of the private and public sectors continued throughout the year, reflecting what had happened the previous year. Private sector wages grew by 8.2%, thanks in particular to the good performance of SMEs (15.1%, -12.4% in 2020), which were more evident in the second half of the year. In large companies, growth was 3.4%, compared to the 2.7% drop experienced in 2020. Compared to 2019, the private sector wage bill was 0.7% higher in 2021 than it was then (0.6% in large companies and 0.8% in SMEs). Public revenues (wages, pensions and benefits) grew by 0.4%, a relatively low rate that is justified by the comparison with 2020, with very high levels of unemployment benefits (which include transfers linked to ERTE). As regards public salaries, growth in the year was 5.1% (5.2% a year earlier), with the trend towards moderation being confirmed in the fourth quarter once the impact of the higher hiring in the health and education sectors in the second half of 2020 and the increases resulting from the salary equalisation process in the security forces was absorbed. Finally, public pensions maintained growth of around 3.5% throughout the year. Around two and a half points of the improvement compared to 2020 was due to the increase in the average pension, which occurred due to the revaluation at the beginning of the year and, as usual, due to the incorporation of pensioners with higher average pensions than those already in the system. The increase in the number of pensioners explains the remaining increase.
For household capital income as a whole, growth of 12.6% is estimated in 2021, after a 12% drop in 2020. This progress was not enough to recover the 2019 levels (they were 1% below). The evolution was very uneven across the different assets. Income from movable capital closed the year with a decrease of 2.2%, which was added to the 19.7% decrease in 2020, which represents a drop of 21.5% compared to 2019. Income from real estate capital, on the other hand, increased its dynamism throughout the year, so that for 2021 the growth was estimated at 7.5% compared to 2020 and 1% compared to 2019. Within these incomes, the performance of those from the leasing of premises was worse than that of the whole: grew by 5% in the year, but are still below (10.1%) those seen in 2019. In terms of capital gains, the income with the best results in 2021, the increase was 31%, highlighting the exceptional increase in gains linked to investment funds (80%, which adds to the 12.3% growth in 2020).
Finally, regarding personal business profits, they grew by 20.6% in 2021, after a 14.6% decline in 2020. It should be remembered that these companies are highly concentrated in activities that were particularly affected by mobility restrictions (transport, hospitality, personal and leisure services) and, therefore, a marked rebound was to be expected in 2021 as these restrictions were relaxed. However, the recovery was better than expected and, even though restrictions were not completely lifted, the result in 2021 was 3% higher than the levels reached in 2019.
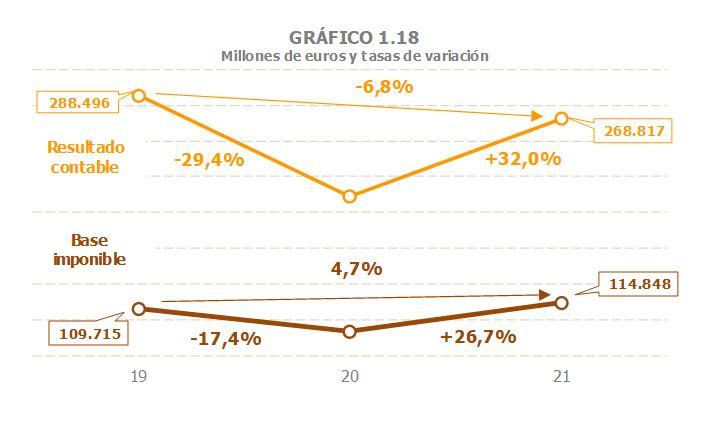
The consolidated tax base of Corporate Income Tax grew by 26.7% in 2021 ( Table 3.1 ). The rate is calculated based on amounts that have been greatly affected by the impact of the pandemic, so the comparison with 2019 is more informative. In this case the increase is estimated at 4.7%. Profits, meanwhile, grew by 32%, largely in response to the sharp decline in 2020, but also due to the contribution of some extraordinary operations (a bank merger and the sale of assets of a large company). Compared to 2019, profits in 2021 were still 6.8% below those of that year. The information declared in the fractional payments ( Table 3.2 ) indicates that the increase in profits and the tax base was greater in the groups (even eliminating the impact of the merger and the sale of assets) than in Large Companies and in SMEs that declare according to the profit of the period.
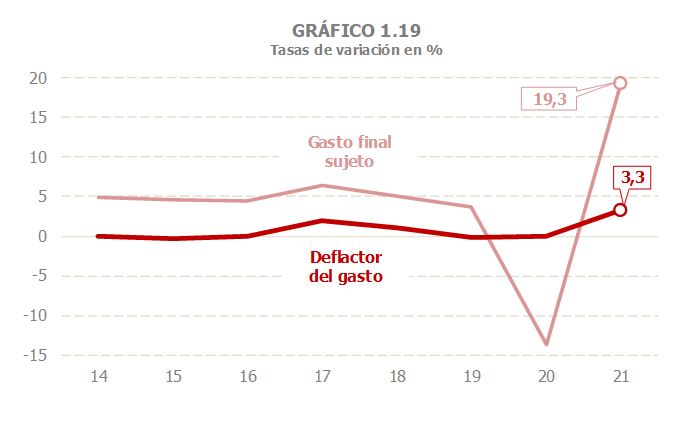
final expenditure subject to VAT showed intense growth in 2021, closing the year 19.3% above the level reached in 2020 ( Tables 1.3 and 4.1 ). Spending was also 3% higher than in 2019. In the latter part of 2021, there was a significant increase in prices that favoured an increase in nominal spending, although, as can be seen in Chart 1.19, in the year most of the increase was due to the increase in real spending. From the component point of view, the greatest growth occurred in household spending (which is the group with the greatest weight in the total and the one most affected by restrictions in 2020) for which an annual growth of 21.8% is estimated, above the 2019 figure (+1.2%). Spending on home purchases rose by 16.4% in 2021, while current and capital expenditure by public administrations grew by 7.1% (in both cases the rates with respect to 2019 exceeded 11%).
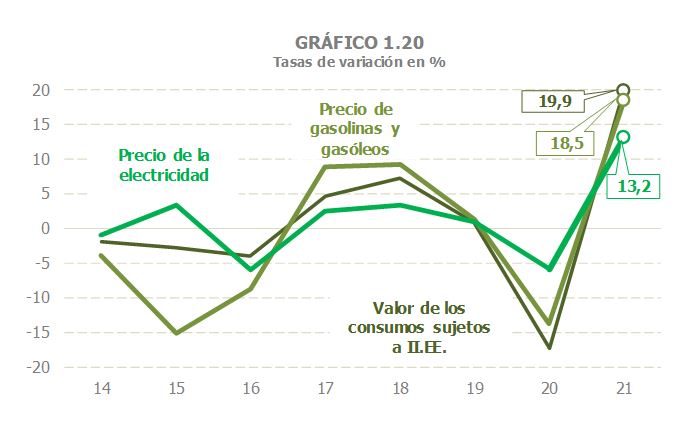
Regarding Excise Taxes, the value of consumption subject to Excise Taxes increased by 19.9% in 2021 ( Tables 1.3 and 5.1 ). This increase was not sufficient (except in the case of electricity) to recover the 2019 levels after the sharp contraction suffered in 2020, a consequence of both the negative evolution of consumption and the fall in prices, the latter particularly intense in fuels and electricity. The recovery in the value of consumption in 2021 is explained precisely by the upward trend of both components. Except for tobacco products, both consumption and prices increased in 2021, highlighting the sharp increase since mid-year in the prices of gasoline and diesel ( Table 9.1 ) and electricity ( Table 5.7 ), not only offsetting the previous drop, but also growing to reach maximums (since 2014 in the case of gasoline and diesel, the highest in the series in the case of electricity). However, it should be remembered that, as will be seen later, despite the increase in prices, this did not translate into higher revenues, either because, as with petrol and diesel, the tax is based on physical consumption (therefore, the rise in prices does not increase revenue, but rather reduces it), or because, as with electricity, the rate was lowered as part of the set of measures aimed at mitigating the effect of these price increases.