The economic climate
In 2021, the economic context was mainly characterized by two elements: the progressive improvement in activity and the rise in prices, both particularly strong in the second half of the year.
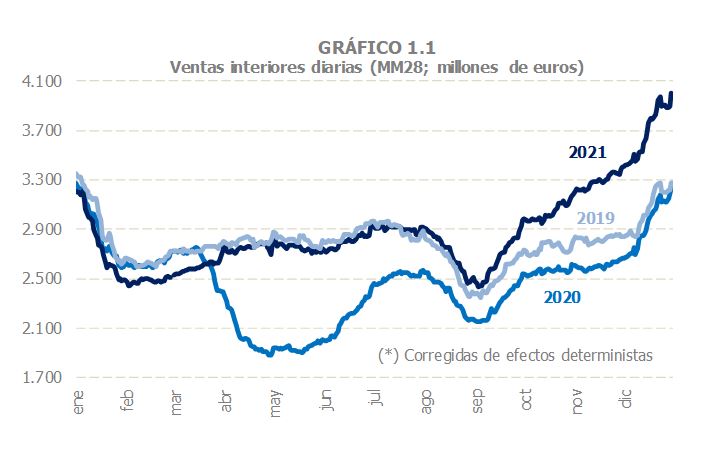
The year got off to a bad start, marked by the effects of the third wave of infections and the repercussions of storm Filomena. After the first few weeks in which activity was still below pre-pandemic figures, sales began to recover and were already significantly above those of 2019 in August. Chart 1.1 illustrates this evolution. The series shown are the daily sales provided by the Immediate Supply of VAT Information system , the activity indicator that is closest to what is happening in the economy. As can be seen, until the end of March sales were lower than in 2019 and 2020, but after that month there was a continuous progression that led to the end of the year with growth above 20% compared to 2020 and 4% compared to the whole of 2019.
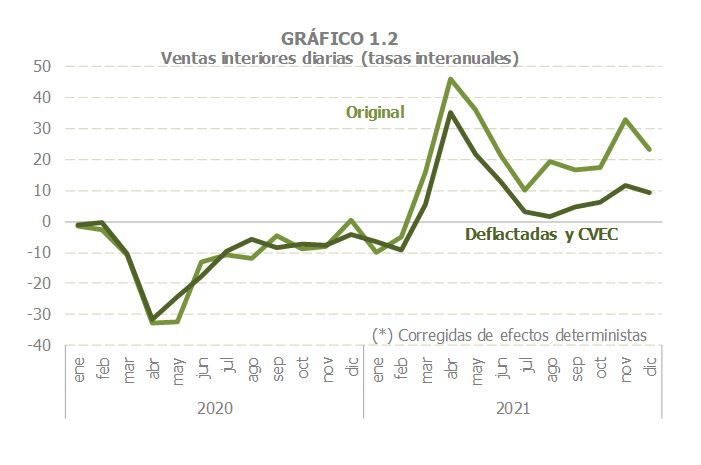
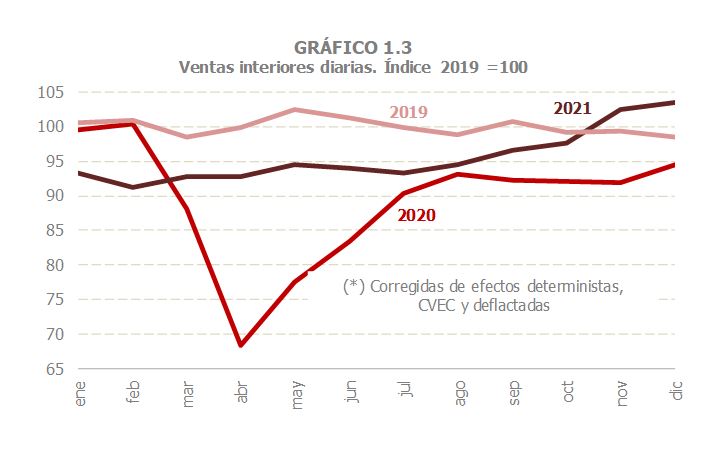
The improvement in daily sales was influenced by both the real component and price increases, which became more pronounced as the year progressed. Chart 1.2 gives a good idea of the effect of prices, especially compared to the sluggishness of prices in 2020. From the beginning of the year, a greater nominal than real dynamism was observed and this difference became more pronounced as the months went by. In the fourth quarter, prices accounted for an average of around 15 points of sales growth. In any case, once prices have been discounted, the last months of 2021 were already above those of 2019, as shown in Chart 1.3.
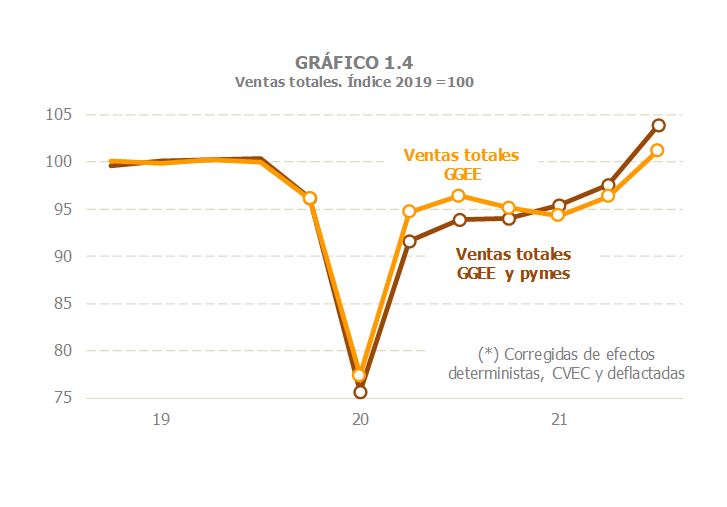
Other sales indicators based on tax information offered similar signals. Chart 1.4 reflects the quarterly evolution of the total sales of Large Companies and corporate SMEs in the last three full years. Particularly in the indicator with the highest coverage, that of Large Companies and corporate SMEs, the continuous improvement since the minimum caused by the strict confinement in the second quarter of 2020 is clearly observed. When analyzing the graph, two facts in particular stand out: On the one hand, a more consistent progression in SMEs than in Large Companies (due to the greater weight in the former of the activities that suffered the most from restrictions throughout the pandemic period) and, on the other, the significant acceleration of sales in the final part of the year, closing the last quarter above the results of 2019. For the year as a whole, total sales of large companies and SMEs were, in real terms, only 2.3% lower than in 2019.
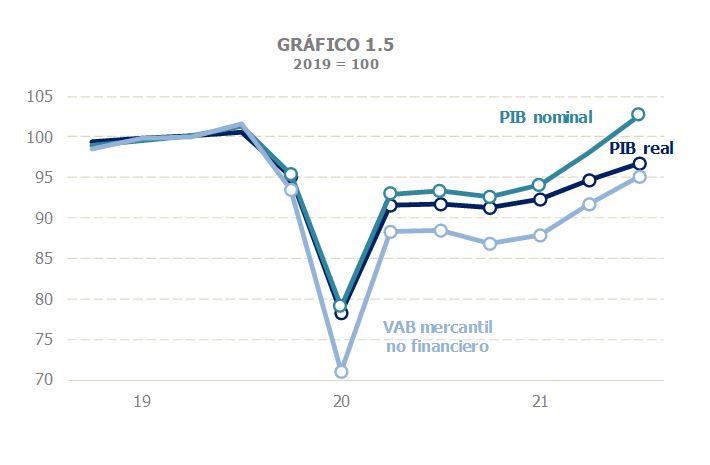
In the aggregate most commonly used to monitor the economic situation, GDP , the two elements mentioned as characteristic of 2021 can also be seen, although with a lower intensity than that deduced from the fiscal variables. In real terms, GDP grew by 5.1% over the year, going from a quarterly decline of 0.5% in the first quarter to an average increase of 2.4% in the second half of the year. Nominal GDP, for its part, increased by 7.4% in 2021, with a quarterly decline of 0.8% in the first quarter and growth of 4.8% in the last (4.5% in the second half of the year). In both cases, the figures for the year were far from those of 2019: a -6.2% in the first case and a -3.2% in the second. Even further behind was the nominal non-financial commercial GVA, which is an aggregate closer to what fiscal sales represent. In this case, the year closed almost 10% below what was the case in 2019, a result very different from that deduced from sales. Chart 1.5 shows these three aggregates (real GDP, nominal GDP and commercial GVA) on a quarterly basis and in comparison with the year prior to the outbreak of COVID.
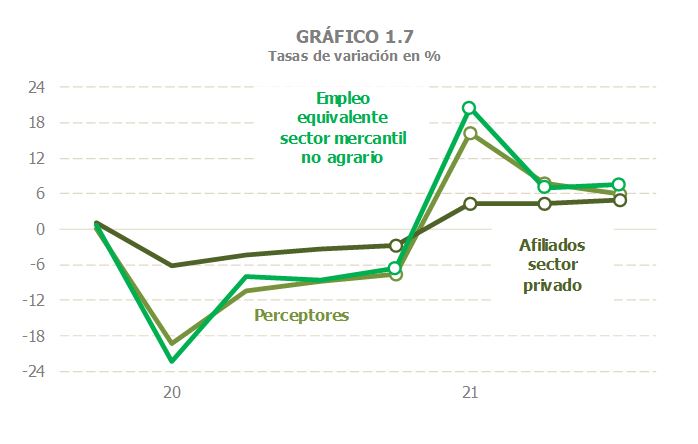
The other relevant indicator in the current situation monitoring is employment , although whatever approximation is used it is highly conditioned by the effect of the ERTE, which influences differently depending on the sources and therefore the results and conclusions that can be drawn from them are also different. For example, membership began to register growth compared to 2019 figures from June onwards, and the figure for December was already 2% higher than that of the same month of that year. In 2018, average membership was slightly higher than in 2019, as shown in Chart 1.6. However, membership does not allow for the precise elimination of the impact of ERTE on the work actually performed. The hours worked in the National Accounting would be the most appropriate indicator, but its practically stable behaviour since the second quarter of the year (precisely in the period in which activity improved the most) and the strong sectoral changes that have occurred in recent years make its interpretation difficult. Full-time equivalent employment, which is a transformation of hours from the average working day to full-time (not easy to define or estimate in these years), is also not immune to these problems (the notable differences between hours and equivalent employment in the last two quarters of 2021, which can be seen in Chart 1.6, are a good example of this). Compared to 2019, the National Accounting employment measures in 2021 were, for the whole year, below those of 2019, although in the case of equivalent employment in the last two quarters they already exceeded the average for that year.

For its part, the fiscal employment indicator, the number of recipients of work remuneration from the withholding tax returns of Large Companies and corporate SMEs, followed a trajectory throughout the year similar to that estimated by the National Accounting for full-time equivalent employees in non-financial commercial activities (this detail is important because we must remember the different behaviour of public employment in the last two years). In Chart 1.7 you can see this similarity and the difference with salaried members, with different treatment, as has been said, of the ERTE. Only the latter reached 2019 levels.
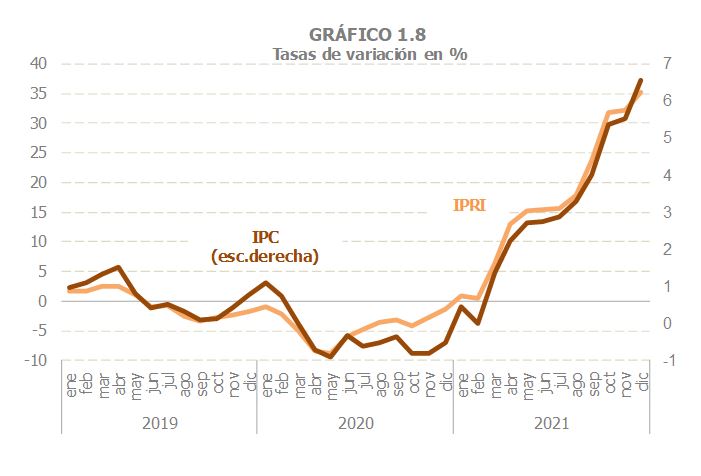
As regards the second characteristic feature of the year, the evolution of prices , Chart 1.8 clearly illustrates the peculiar behaviour of the same through the two basic indicators: the Industrial Price Index (IPRI) and the CPI. The strong rebound that has been taking place since the first months of 2021 is noteworthy, especially compared to the negative rates that had been the norm in 2020, a consequence of the collapse caused by the lockdown in much of the world. The rebound is observed in both the IPRI and the CPI, although the intensity is very different (note the difference in the scales). The acceleration in prices is also more pronounced when analysing monthly data than when assessing the entire year. In annual terms, the general CPI ended the year with an increase of 3.1% (0.8% for the core CPI, which does not include energy products or unprocessed foods), having remained at an average of less than 2% for half of the year and including an upward bias due to the fact that the measurement of electricity prices is based on the regulated tariff (in fact, the private consumption deflator in National Accounting only grew by 1.9% in 2021).
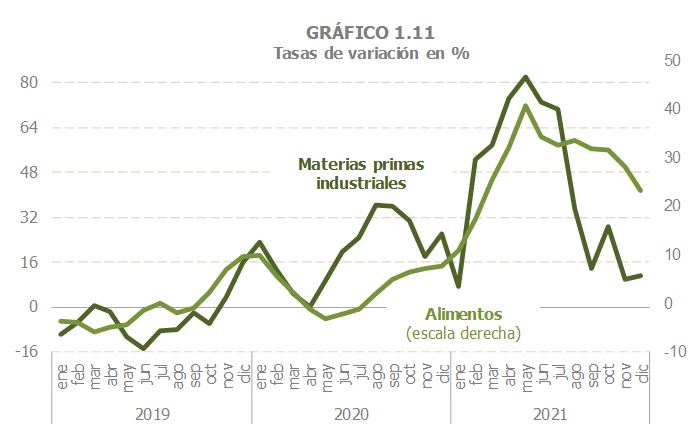
It is also worth highlighting two facts linked to this price evolution. First, most of the rally is due to the significant increase in energy prices that has occurred since March (see Chart 1.9), although the previous downward trajectory had changed since mid-2020. And secondly, even taking into account the importance of the energy factor, the behavior of the IPRI without energy shows (Chart 1.10) that the inflationary process had a more general character. Industrial prices had begun to recover pre-pandemic growth rates in the last months of 2020 and from the first months of 2021 they showed a clear upward trend, although this was not reflected in the core of consumer prices until almost the end of the year (the CPI excluding energy only rose above 2% in December, and the same happened with the core CPI). The increases in industrial prices can be understood by analysing the prices of industrial raw materials (“The Economist” index) and food (FAO) in international markets (Chart 1.11), which were already registering growth in the central months of 2020. Looking at it from a more perspective, it can even be concluded that inflationary tensions had begun at the end of 2019, but that the pandemic slowed them down. Once things began to return to normal, tensions flared up again, this time with greater intensity.


Finally, it is worth mentioning, although it is discussed in different sections throughout the report and in detail in Information Note 1, the possible influence of this inflationary upturn on income growth. The first thing to say is that, in general, there is no direct or immediate relationship between the rise in prices and the increase in revenue, but in the particular case of 2021 there are also additional reasons to think that the impact of prices was relatively small. The fact that there is no direct and immediate relationship between prices and collection has to do with the existence of income that comes from operations produced in previous years (this is the case, among others, of the differential quotas of direct taxes, annual VAT refunds or settlements carried out by the Administration), or they include delayed price increases (the update of pensions due to price deviations has materialized in 2022, as have salary increases). The most direct relationship between prices and income occurs in indirect taxes, particularly VAT. However, as seen, in annual terms the growth in consumer prices was not so high (3.1%, including the upward bias of the incorrect measurement of the price of electricity) and was concentrated in the second half of the year. Since the accruals for November, December and the fourth quarter, the periods with the highest price increases up to that point, were entered in the first months of 2022, the impact of those higher prices was not reflected in the 2021 collection, but in that of 2022. To this we must add the rate reductions in electricity consumption (in VAT and in the Special Tax on Electricity) that caused a loss in revenue greater than the gain provided by the increase in prices.