2. Personal Income Tax
Income from income tax grew by % to reach 94,546 million. In the context of 2021, the increase is relatively small, but it must be remembered that this tax increased in 2020 thanks to the cushion provided by public income (salaries of the Public Administrations, pensions, transfers linked to ERTE and aid to the self-employed); Therefore, growth in 2021 was also more moderate. The strength of this figure is best appreciated when compared to 2019. In this case, it is concluded that this tax was the one that contributed most to growth compared to that year. Income growth was logically based on the good performance of household income, with all its components, except for income from personal capital, showing good results. SMEs played a prominent role in this overall evolution, both in terms of salaries and in the profits of personal companies.
household incomes grew by % ( ). Given the situation in 2020, the incomes that improved the most were those that performed the worst last year, that is, incomes from the private sector (see Chart 1.15). In contrast, public revenues, which in 2020 had supported household incomes, remained practically stable in 2021. Except for income from capital assets and income from the leasing of premises, the rest of the income recovered strongly, remaining at the end of the year above the level they had in 2019.
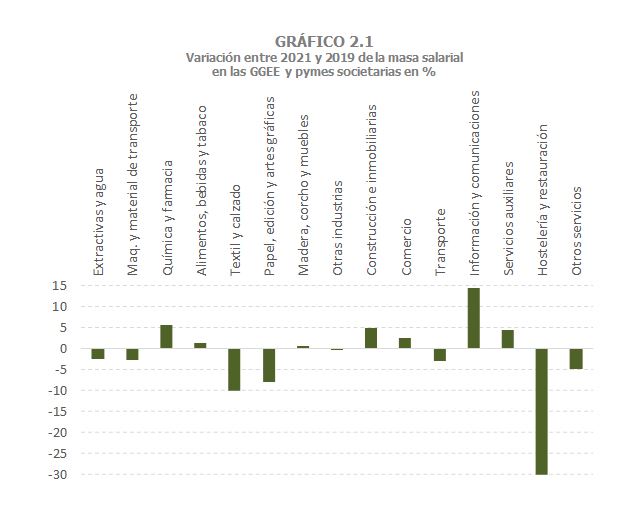
Labor income, which is the main source of income in households, grew by 4.3% ( Table 2.1 ). Wages rose by 7.4%. The trend of the year, reflecting what had happened in 2020, was the uneven evolution in the private and public sectors. Private sector wages grew by 8.2%, thanks in particular to the good performance of SMEs (15.1%, -12.4% in 2020), especially in the second half of the year. In Large Companies, growth was 3.4%, which offset the fall in 2020 (-2.7%). In both cases, the wage bill in 2021 exceeded that of 2019 (+0.6% in Large Companies and +0.8% in SMEs; +0.7% overall). The recovery was uneven by activity, as in 2021 there were still restrictions in some periods of the year that prevented complete normalization. Chart 2.1, which shows the variation in the wage bill between 2021 and 2019 by branch of activity, illustrates this point well.
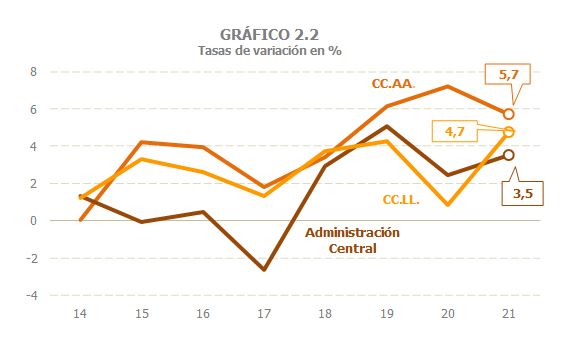
Public sector salaries, for their part, grew by 5.1% (in 2020, 5.2%). Throughout the year, the pace of growth moderated as a result of the gradual absorption of the impact of the hiring in the health and education sectors that took place in 2020 and the increases resulting from the salary equalization process in the security forces. As a result of the above and unlike what happened in 2020, the wage bill grew more due to the increase in employment and less due to the increase in average performance, affected precisely by the entry of new employees with lower average salaries. By administration, they were, as in 2020, the CC.AA. those that registered a greater increase in the wage bill, although the improvement was greater in the CC.LL. (Chart 2.2).
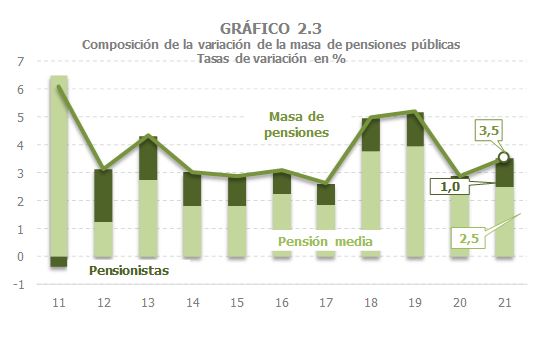
As regards public pensions, the pension pool grew steadily by around 3.5% over the year. Two and a half points were due to the increase in the average pension, which was caused by the revaluation at the beginning of the year and, as usual, by the incorporation of pensioners with higher average pensions than those already in the system. The other part of the growth came from a 1% increase in the number of pensioners. Chart 2.3 compares these results with those of the previous 10 years.
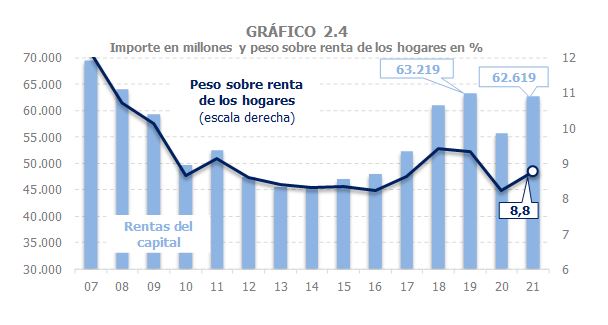
Household capital income (furniture, rents and capital gains) grew by 12.6% ( Tables 2.1 , 2.4 , 2.5 and 2.6 ). Despite the growth, the level recorded before the pandemic was not recovered (Chart 2.4). As can be seen in the graph, the weight that these incomes had within household incomes was also not achieved, a percentage that had grown since 2017 after the slow decline that followed the fall from the highs of the boom years in the first decade of the 2000s.
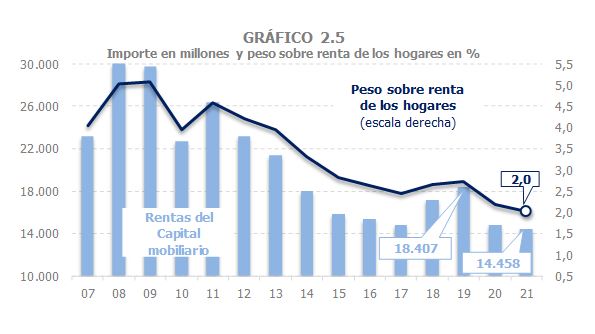
However, the evolution was very uneven across different types of income. Income from movable capital fell again, by 2.2% after the 19.7% loss in 2020. Compared to 2019, these incomes closed the year with a drop of 21.5%. Dividends, which are the most important returns within these incomes, have fallen back to levels prior to 2018, and something similar can be said of other assets, such as fixed income, which, dragged down by low interest rates, have been leaving household portfolios. The result is an evolution as shown in Chart 2.5.
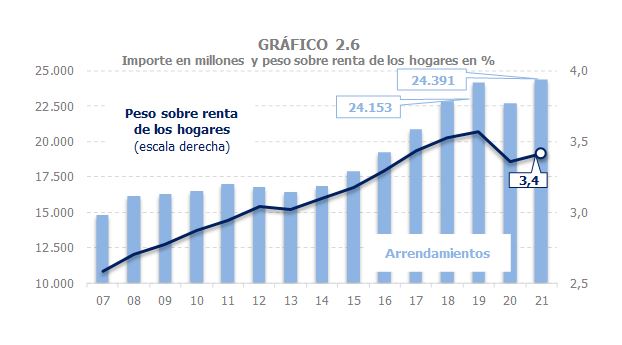
Income from real estate capital suffered considerable losses in 2020 (-6.1%), but recovered in 2021 (+7.5%, +1% compared to 2019). There are two clearly distinguishable trends: the trend followed by residential leases and the trend followed by commercial leases, which are subject to withholding. The former fell in 2020 (-2.7%), but in 2021 they resumed a growth rate similar to those observed before the pandemic (+8.4%; +5.4% compared to 2019). The latter, on the other hand, also grew in 2021 (+5%), but were unable to compensate for the sharp drop they had in 2020 (-14.4%), so they remained far from the 2019 level (-10.1%). The weight of these incomes within household incomes, which had been growing continuously before 2020, grew again without reaching previous levels (Chart 2.6).
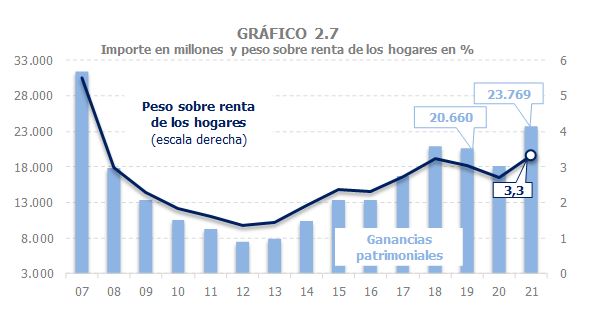
Capital gains were by far the best performing income in 2021: grew by 31% (in 2020 they had decreased by 12.2%). Although its weight is small, the exceptional increase in profits linked to investment funds (80% after growth of 12.3% in 2020) stood out. In the case of these incomes, the comparison with 2019 is almost irrelevant given that the trend they have followed in recent years, accentuated by the good results of 2021, has meant that the amount of these gains has reached its highest level since 2007, as is the case with their weight within household income (Chart 2.7).
As regards personal business profits ( Table 2.8 ), their growth in 2021 was 20.6%, higher than the 14.6% decline in 2020, meaning that income in 2021 ended up being 3% higher than in 2019. The result is all the more remarkable because these companies are highly concentrated in activities such as transport, hospitality and personal and leisure services, which were particularly affected by the restrictions on mobility in 2020 and which in 2021 had not yet returned to normal (it should be remembered that Easter was still celebrated with many restrictions). The improvement in income, both compared to 2020 and, above all, to 2019, was fundamentally an improvement in the average performance per company since the number of entrepreneurs remained at levels similar to those before the pandemic.
The effective rate on gross household income increased by 3.2% ( Table 2.1 and Chart 2.8). The origin of this increase is found in three elements: the regulatory changes with the increase in the rate on the general and savings base for higher incomes (2 points on the state rate from 300,000 euros in the first case and 3 points from 200,000 euros in the second) and the modification of the limits on the reductions linked to pension plans; the increase in the pension rate (due, above all, to the usual sliding effect towards higher average pensions by new pensioners entering the system); and the loss of importance in 2021 of unemployment benefits, with average rates almost zero, and which in 2020 had lowered the effective rate. The increase in the rate caused by these elements was tempered by the fact that throughout the year the contribution to household income from the salaries of SMEs increased, which, with lower average rates, exerted downward pressure on the effective rate, the opposite of what had happened the previous year.
The accrued personal income tax grew by 9.2% in 2021 ( Table 2.1 ). As seen, the growth of the base (household income) explains almost six points of this increase and the rest comes from the higher average effective rate. Compared to 2019, growth was 9%.
Withholdings on income from work and economic activities grew by 7.1%, 6.7% if only those from work are considered ( Table 2.3 ). In the latter case, the amount of remuneration (mainly salaries, pensions and unemployment benefits, including transfers from ERTE) increased less, by 4.2%. The remainder was contributed by the increase in the effective rate as a result of the increase in the rate on pensions (due, above all, to the entry of pensioners with a higher average pension than those who were already receiving it the previous year) and the loss of weight of unemployment benefits, of an exceptionally high amount in 2020 and with an average withholding practically equal to zero. Within salaries, the growth in withholdings was greater in the private sector (7.1% compared to 2020, 4.4% compared to 2019), despite the decrease in the rate due to the recovery of the wage bill in SMEs where the average rate is lower. In the public sector, wage withholdings grew by 5.8%, two points less than in 2020, with a very similar increase in the total wages (5.1% in 2021, 5.2% in 2020). In pensions, withholdings grew by 7.2%, below the 8.8% of 2020. The moderation observed in this part of the withholdings is a consequence of the irregular behavior of private pensions in 2019 and 2020 (a sharp drop in the first of these years and an exceptional increase in the second). Considering only public pensions, the growth in withholdings in 2021 is higher than that observed in 2020 (7.2% compared to 6.4% in the previous year), mainly due to the increase in the pension mass.
Withholdings on capital income increased by 7.4%, but were still below the levels reached in 2019 and even in 2018 ( Table 2.1 ). In the case of withholdings on capital gains, given that there was no change in the rates (the increase in rates based on savings for high incomes will be specified in the annual declaration), the evolution is the same as that of income: a 2.2% drop in 2021, adding to the 20.5% drop in 2020. Compared to 2019, these withholdings are 22.3% lower than those of that year. For their part, withholdings on leases, mainly for premises, rose by 5%, but this growth is insufficient to recover pre-pandemic levels (in 2021 the accrued withholdings were still 10.1% lower than in 2019). Unlike the previous years, withholdings derived from capital gains from investment funds grew again in 2021 and also with unusual intensity (80%, in 2020 they had grown by 12.3%). Since these withholdings have been in force, only in four years (1999, 2000, 2007 and 2008) have levels higher than those of 2021 been recorded.
As regards installment payments, they increased by 25.6%, a rate conditioned by the comparison with 2020, which was affected by the various measures adopted to alleviate the effects of the pandemic among companies that have opted for the objective estimation modality. However, compared to 2019, payments in 2021 were 10% higher than in 2021, which gives an idea of the intensity of the recovery of SMEs, especially in the last part of the year.
Income from labor withholdings in the private sector decreased by 0.8%. This figure includes the amounts from deferrals granted in the first months of the pandemic and which were recovered throughout the year (other income in Table 2.3). The drop was not large compared to that observed in activity due to the impact of the ERTE on employment (workers remained in the company, although part of their salary was covered by the SEPE) and the increase in the effective rate of wages (due to the greater impact of the crisis in sectors of activity with low salary levels). This different impact of the crisis on the different productive sectors helps to explain the disparity between the slight increase in income from withholdings recorded in large companies (0.8%) and the 4.1% decline observed in SMEs (including other income). In the PP.AA. withholding tax revenues increased by 7%. The behavior was similar to that of these incomes in 2019 (growth then was 6.5%) and this can be said for both salaries and pensions. In the first case, there was an increase in the last part of the year due to the increase in withholdings from health and education, and due to the payment of the third tranche of salary adjustments in the security forces. The final growth in 2020 of withholdings from public salaries was over 7%, with an increase of over 5% in the wage bill and the rest due to the rise in the average rate. In pensions, withholdings grew by around 6.5%, a slightly higher increase than in 2019 and with a different distribution: The average pension rose less (in 2020 there were no increases as in 2018 and 2019) and the effective rate rose much more (3.5% compared to 2019 when it barely grew because the lowest pensions benefited from greater increases), even offsetting the lower growth in the number of pensioners (0.5%, 1.2% in 2019).
As regards installment payments, they increased by 25.6%, a rate conditioned by the comparison with 2020, which was affected by the various measures adopted to alleviate the effects of the pandemic among companies that have opted for the objective estimation modality. However, compared to 2019, payments in 2021 were 10% higher than in 2021, which gives an idea of the intensity of the recovery of SMEs, especially in the last part of the year.
Income from personal income tax grew by 7.5% (+8.8% compared to 2019). The figure is lower than that shown by the taxes accrued. The difference basically has to do with two factors: The accrued tax includes regulatory measures (such as rate increases for high incomes) that affect the annual declaration and that, therefore, will take effect in 2022, and the shifting of the latest accruals between one year and the next (the 2021 cash register includes the bad results from the end of 2020, but not the good results from 2021, which are carried over to 2022).
Growth in 2021 was based on four elements: the increase in withholdings from work (particularly from SMEs), the decrease in refunds (including the Allocation to the Catholic Church, whose settlement for 2019 was brought forward to December 2020), the growth of fractional payments from personal companies and the exceptional increase in withholdings on capital gains in investment funds. In 2021, income from withholdings on work and economic activities grew by 6.1% (7.7% compared to 2019). The increase was even in the private and public sectors (7% and 6.8% respectively), although it should be noted that in the public administrations. Last year was also a year of growth and part of the private sector's withholdings in 2020 were recorded in the rest of the income as they were affected by the deferrals caused by the fiscal measures to alleviate the situation of lack of business activity (if these amounts are added in 2020, the increase in the private sector would be reduced by one and a half points).
Within the private sector, the greatest growth was observed in SMEs, whose income from withholdings grew by 14.7% compared to 3.6% for Large Companies. The latter did not fall in 2020 due to the existence of some extraordinary income and this meant that the rate in 2021 was not very high. In any case, compared to 2019, SMEs also recovered their position more intensely than Large Companies (5.4% in the former, 4.4% in the latter). In this comparison with 2019, the factor of the sectoral change that has occurred in the last two years must be included, reducing the importance of activities with lower than average wages and effective rates. This factor has led to an increase in the withholding rate and, consequently, withholdings exceeding the level of two years ago, more clearly than the wage bill did (+0.7% compared to 2019).
In terms of income from PA withholdings, those from salaries grew by 6.6% and those from pensions by 7.2%; in the first case below 2020 and, in the second, the opposite. In terms of wages, the year began with a high growth rate, similar to that observed after the summer of 2020 as a result of hiring in the health and education sectors. This impact (and another similar one resulting from the regularisation of the salaries of security forces) gradually faded as the months went by and, except for the occasional increase, the trend was one of moderation. Unlike 2020, when growth occurred despite the drop in employment in the CC.LL. And in the Central Administration, in 2021 the final result of the year was due, above all, precisely to the increase in employment, which also caused salary increases and the effective rate to moderate. In pensions, however, the pattern was one of relative stability throughout the year, with increases of around 7.1% since March, distributed evenly between the increase in the pension mass and the rate.
The second element that allowed the increase in income was the returns made. Those linked to the annual declaration decreased by 4.6%. Most of them correspond to refund requests from the 2020 Income Tax Campaign, which, given the special circumstances of that year, were reduced by 5.9% compared to the previous campaign. Added to this is the fact that the way in which the annual settlement of the Assignment to the Catholic Church was carried out was also outside the normal pattern. This settlement is usually made in January for the outstanding balances from the declaration from two years prior. However, the 2019 tax, which should have been paid in January 2021, was brought forward to December 2020. The consequence was that in 2021 the amounts for this concept were lower than in 2020 and, therefore, their negative impact on income was also lower.
In line with what has been discussed elsewhere in this report, the high growth in SMEs was also reflected in a significant increase in the split payments of personal companies: 17.4% compared to 2020 and 5.7% above 2019. Payments were affected by several regulatory measures in 2020 and 2021, although the one with the greatest impact (the increase in the general reduction approved at the end of 2020) had an effect on the annual declaration (in fact, the decrease in income in this was practically the same amount as the estimated impact of said measure).
The last element to highlight in 2021 was the exceptional growth in withholdings derived from capital gains in investment funds. In 2020 they had not had bad results (they were the only withholdings on capital income that did not fall, they even rose by around 12%), but in 2021 their increase was extraordinary: 86.2%. Never before has a level like that of 2021 (1,052 million) been reached. The situation was not as favourable with regard to other capital retentions. Withholdings on capital gains recorded a 7.4% growth, insufficient to offset the sharp drop in 2020 (-20%), meaning that income remains more than 14% below that obtained in 2019. And something similar can be said about withholding taxes on leases; In 2021, they were practically at the same level as in 2020 and, therefore, their income remains far from that of 2019 (-7.6%).