3. Corporate Income Tax
In 2021 revenue from Corporate Tax increased by 67.9%, a very high rate, as was the fall in 2020 (-33.2%) and which responds to the same reasons. In 2020, most of the decline was due to the drop in installments due to the decline in activity caused by the pandemic, and in 2021, most of the growth was due to the increase in installments (53.7%). However, the figure is also good compared to 2019 (12.2% higher). Revenues benefited from some extraordinary operations; Taking this into account, payments would still be above those of 2019 (3.1%). The other element that explained the decline in 2020 and the rise in 2021 was the returns made. In 2020, they reached a very high level because of the returns requested for the 2018 financial year. This was a one-off event that was not repeated in 2019, so in 2021 the refunds made were of a much smaller amount.
The consolidated tax base of Corporate Income Tax grew by 26.7% in 2021 ( Table 3.1 ). The rate is calculated based on amounts that have been greatly affected by the impact of the pandemic, so the comparison with 2019 is more informative. In this case the increase is estimated at 4.7%. Profits, meanwhile, grew by 32%, largely in response to the sharp decline in 2020, but also due to the contribution of some extraordinary operations (a bank merger and the sale of assets of a large company). Compared to 2019, profits in 2021 were still 6.8% below those of that year. The information declared in the fractional payments ( Table 3.2 ) indicates that the increase in profits and the tax base was greater in the groups (even eliminating the impact of the merger and the sale of assets) than in the Large Companies and in the SMEs that declare according to the profit of the period.
From a broader perspective, as shown in Chart 3.1, it can be seen that, although the maximum profits of 2019 were not reached, the results of 2021 were better than those of any other year in the historical series. The same cannot be said of the tax base or the tax accrued. A more detailed analysis of this process that the tax has been undergoing for years can be carried out with the information provided in Table 8.5 .

The effective rate on the tax base rose 4% over the estimate for 2020 ( Table 3.1 ; Chart 3.5). If the rate is calculated on profits, the result is a rate almost equal to that of the previous year (9.15% compared to 9.17% in 2020). The variation in rates is almost exclusively a consequence of the different growth estimated for bases and rates in the different groups of companies. The only relevant regulatory change with an impact (the limitation on exemptions on foreign income in article 21 of the law) slightly raised the rate in the group of companies affected, although its importance in the whole is less significant.
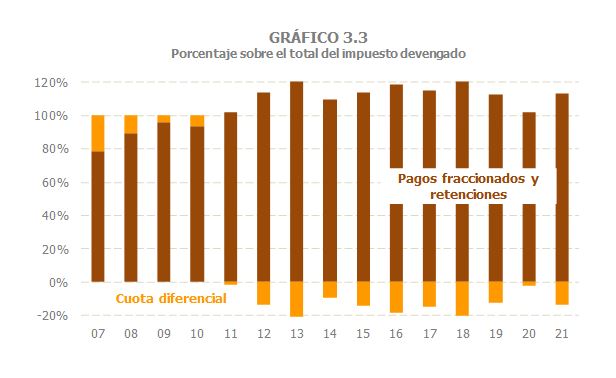
The Corporate Tax accrued grew by 31.8% ( Table 3.1 ), a figure close to the growth estimated for profits. The sharp increase observed in split payments (50.4%) is not directly transferred to the tax because part of this growth translates into a more negative differential rate. This amount is estimated (the deadline for filing for most taxpayers ends at the end of July), but it already includes the impact that the fact that a significant part of the payments came from the minimum payment (which is calculated on the result and not on the taxable base) will have on it. Chart 3.2 shows this effect: When the minimum payment contribution exceeds 20%, refund requests are above 9 billion. As is well known, the explanation for this fact is that the companies most affected by the payment usually have a low or zero tax base, so that, in the end, these payments only mean higher refunds, but not higher taxes. As can be seen in Chart 3.3, this evolution means, in terms of distribution between quota and payments and withholdings, returning to a situation similar to that recorded before 2020.

The reasons for the exceptional increase in split payments ( Table 3.2 ) are twofold: the good performance of the bases and the greater contribution of the minimum payment. By type of taxpayer, the largest increases were observed in the groups (even without the impact of the two extraordinary operations) that almost doubled (92.8%) the payments of 2020, although they were also the ones that registered the largest drop then. Compared to 2019, payments would be 20.3% higher than those of that year (Chart 3.4), and adjusted for atypical items, 3.1%. In Large Companies, payments grew by 22.3% (2.8% more than in 2019). In SMEs, growth was 9.6%, reaching a level 4.4% higher than in 2019. It should be noted that part of these payments are not linked to profits, but are calculated using the previous year's quota, in this case 2020, and therefore they barely grew (0.7%) and their level is even lower than in 2019 (-1.3%). In the rest of the SMEs, those that pay according to the profit of the period, the payments behaved like the rest of the companies that declare according to the results of the year (39.4% compared to 2020 and 21.3% compared to 2019).

Cash income grew by 67.9% ( Table 3.1 ). This rate does not allow a correct assessment of the revenue collected in 2021 because it must be remembered that in 2020 the drop was very large (-33.2%) and not all of it was due to economic reasons (around 10 points were explained by the management of refunds). Therefore, it is better to make comparisons with 2019. In this case, it is concluded that the 2021 tax collection was 12.2% higher than that of that year. This growth includes the impact of the extraordinary corporate transactions already mentioned, which contributed approximately €2 billion in additional income not linked to the normal evolution of profits. Not including these additional revenues, tax collection would also be higher than two years earlier, but only by 3.8%.
In 2021, there is a large difference between cash income and accrued tax (67.9% compared to 31.8% previously). The main reason is the different way in which the results of the annual declaration are recorded (in cash at the time when the income or returns are made; accrued in the year of the same). This difference, which occurs every year, is accentuated when the amount of the refunds is high (as just seen in the previous paragraph) and, related to this, when, as in 2021, the minimum fractional payment is high (with the consequences that have been pointed out on previous pages). The “transition from accrual to cash” section of Chart 3.5 clearly expresses these differences.
Most of the tax growth in 2021 is explained by the evolution of fractional payments. Payments increased by 53.7% (-27.1% in 2020). The final payment figure was 12.2% higher than in 2019 (3.1% if the aforementioned atypical events are taken into account). The profile for the year was a reflection of what happened in 2020, in which the initial weeks of confinement had a strong impact on the first payment and the second payment accounted for most of the interruption in activity. Thus, strong growth was observed in the first and second payments in 2021 and more moderate growth in the third.
Another part of the tax increase was due to fewer refunds. As already noted, in 2020 these refunds reached, for various reasons, a very high amount (more than 11.5 billion for the annual declaration alone). In 2021, these returns returned to a figure more in line with what they were in previous years (8,629 million; 8,604 on average for the period 2017-2019). The positive effect of these lower returns was slightly offset by the gross income from the annual declaration, which, for the 2020 financial year, showed a decrease of 6.7%.