The economic climate
The two features that characterized 2022 were the intense growth in activity, especially until the last third of the year, and high inflation, which continued throughout the year.
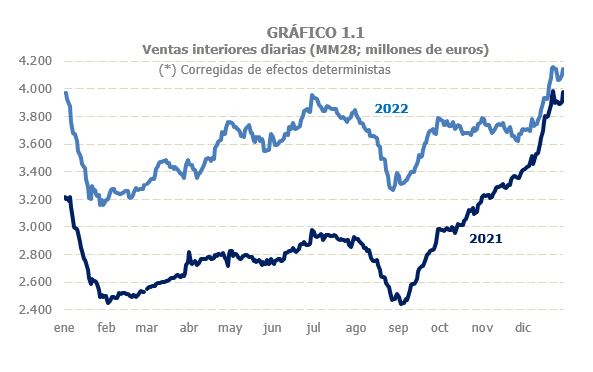
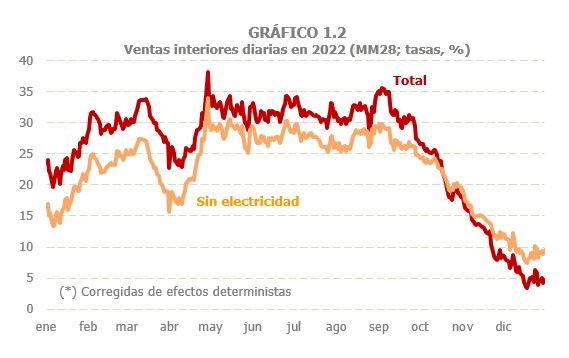
The best indicator for detailed monitoring of activity in real time is the one provided by the daily sales of the Immediate Supply of VAT Information system , published weekly on the AEAT website and whose evolution in 2021 and 2022 is shown, in various ways, in Charts 1.1, 1.2 and 1.3. In 2021, after a shaky start and a continued recovery in the middle part of the year, there was a sharp acceleration in the last part, caused in part by sharp price increases. These high growth rates were recorded in 2022 until approximately September, with the only exception being the temporary interruption at the end of March as a result of the transport strike. From that moment on, the trend was downwards in both nominal and real terms. All of this can be seen in the graphs. The first one contains the level of daily sales. The approach observed in the final part of the year corresponds to the deceleration seen in Chart 1.2 since September. Chart 1.3 shows the series in monthly aggregation to assess the impact of prices and the moderation of real activity in the last part of the year.

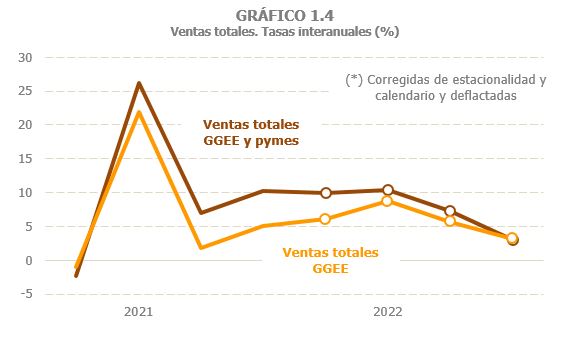
The same profile is reproduced in the quarterly evolution of the total sales of Large Companies and corporate SMEs , shown in Chart 1.4. This indicator has the greatest coverage (more than 1.1 million companies) in the statistical panorama. As can be seen, the strong growth of the first half of the year, part of which was due to the poor results of the first quarter of 2021, still with the impact of the limitations on activity and the Filomena storm, was attenuated in the third and fourth quarters. These restrictions had affected activities with a greater presence of small businesses the most; As the situation normalised and growth moderated, the gap between large and small companies also narrowed.
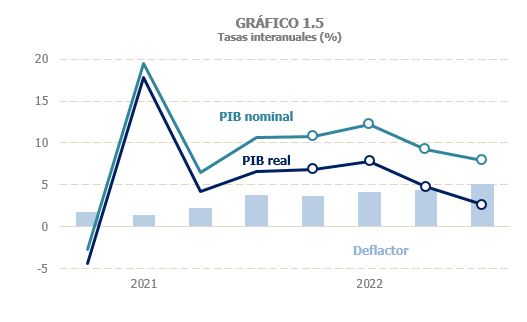
The trend towards moderation was also reflected in the GDP , the most commonly used macroeconomic summary indicator in current affairs analysis. In 2022, real growth was 5.5%, the same rate that had been estimated for 2021. According to this indicator, growth was concentrated in the second quarter, while in the rest of the periods the inter-quarterly growth was close to zero. Unlike 2021, which was still partially conditioned by the effects of COVID and the subsequent recovery, in 2022 the recovery of foreign tourism meant that the contribution of external demand was closer to that of domestic demand (a year earlier, practically all growth came from the latter). In nominal terms, GDP growth in 2022 was 10% (7.9% in 2021), reflecting increased price pressure. The slowdown in the latter part of the year, however, was less pronounced than in real activity. Figure 1.5 illustrates this fact: The increase in the implicit deflator became larger as the year progressed. It should be noted in this regard that the deflator measures the prices of added value and, therefore, may behave differently from other production or consumer prices. In fact, according to the evolution that can be deduced from these data, the price increases would have been, in principle, an inflation caused by intermediate consumption and only in the second half of the year would these price tensions have been transferred to remuneration and the business surplus and, therefore, to the GDP deflator.
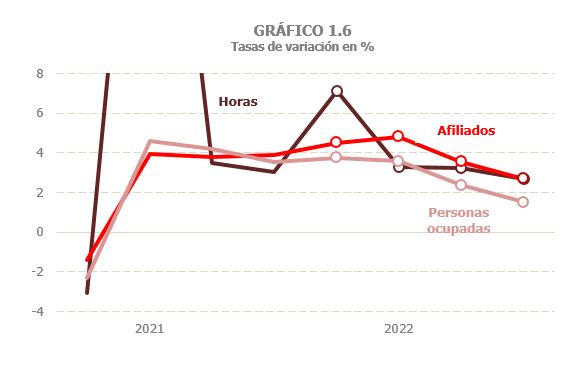
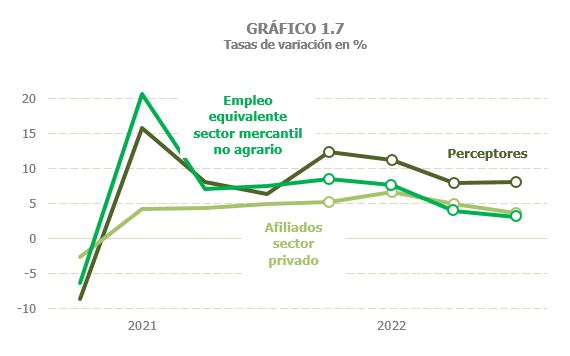
As regards the evolution of employment , the trajectory was not very different from that experienced by the activity. Chart 1.6 shows three of the possible indicators available: the hours and people employed in the National Accounting and the number of members of Social Security. The last two were affected in 2020 and 2021 by the way in which ERTEs were accounted for, hence the need to also consider the hours worked, a better approximation to the amount of work actually used. In 2022, this problem was not relevant and it is therefore irrelevant whether one indicator or the other is used. In any case, all three point to a slowdown in the second half of the year, more pronounced in the number of hours due to the atypical data for the first quarter. The number of hours worked grew by 4.1% over the year as a whole, with 5.2% in the first half of the year and 3% in the second. Among employed persons, the increase in 2022 was 2.8% (2.5% in 2021) with growth of 3.7% in the first half and 1.9% in the second. Somewhat higher numbers were recorded for membership, although in the same direction: 3.9% in the year with an average of 4.7% in the first six months and 3.1% in the second half of the year. Chart 1.7, which includes the National Accounting employment, the membership and the recipients of Large Companies and corporate SMEs (the fiscal indicator of employment), all of them referring to the non-financial commercial economy, reinforces this same idea, that is, initial quarters still with a strong employment boost and a subsequent deceleration, more intense in the final months of the year.
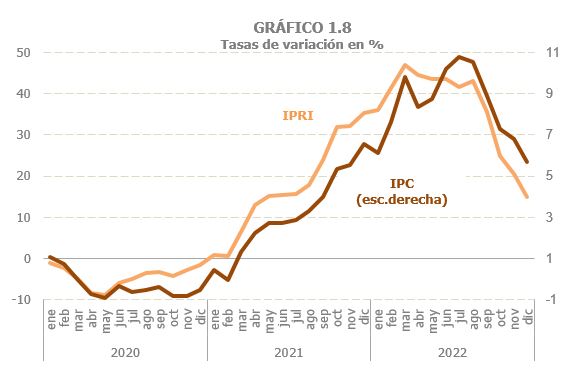
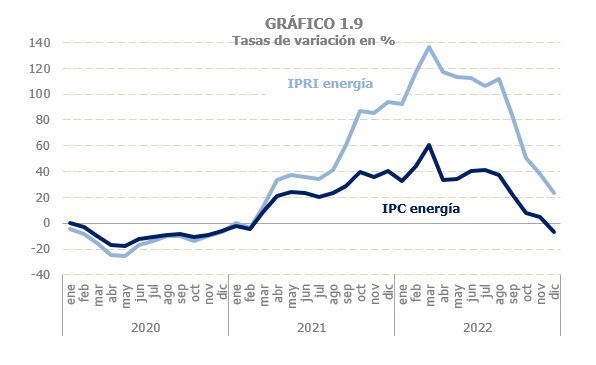
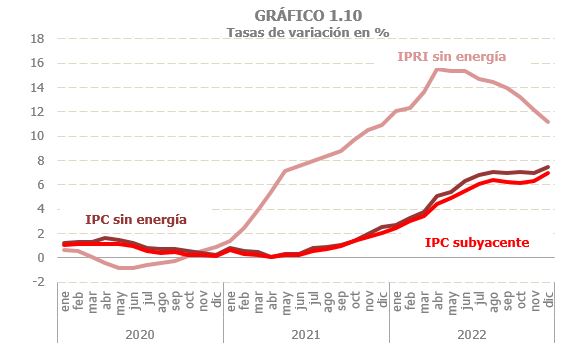
Charts 1.8, 1.9 and 1.10 clearly express the behavior of prices in 2022. The charts include both industrial production prices (IPRI) and consumer prices (CPI). Prices had begun to rebound in the first months of 2021 and continued to rise throughout the year. Peak growth was reached in the first half of 2022, but moderated during the rest of the year, especially in the latter part. Several aspects of this process are worth highlighting. First, as already analyzed last year, inflation was much more severe in production than in consumption. The profile was the same (as seen in Figure 1.8), but the intensity was very different (note the scales). The second aspect to highlight is that, although inflation derived from the energy component was fundamental (Chart 1.9), the explanation did not end there; The prices of other products and services also grew significantly (Chart 1.10). And thirdly, what is precisely characteristic of 2022 is that, while in the second half of the year the price of energy began to moderate its growth, non-energy prices continued to grow, still at very high rates in production prices and within an upward trend in the case of consumer prices (Chart 1.10).