2. Personal Income Tax
Income from income tax grew by % in 2022, reaching 109,485 million, almost 15,000 million more than the previous year, almost half of the growth in total income. The reasons for the increase were the rise in employment (particularly in the private sector), the rise in average wages and pensions, and the resulting rise in the effective rate. Added to these factors are the positive results of the 2021 annual declaration submitted at the end of June 2022 and the growth in personal business profits.
household income grew by 8.1 (Table , two points more than the previous year. All of its components improved, with the exception of unemployment benefits and capital gains (which in 2021 were already at figures just below the peaks of 2006 and 2007). Growth was particularly strong in private income, around 11% for the second consecutive year. Public income, on the other hand, showed a somewhat more moderate increase, limited by lower unemployment benefits, with an increase of close to 8% in pensions and of around 5% in public salaries.
The main component of household income, labor income, grew by 7.0% in 2022 (4.2% in 2021, Table 2.1 ). Among its main components, wage and pension growth was higher than that achieved a year earlier, while unemployment benefits decreased due to both a lower number of unemployed and a decrease in the average benefit. The evolution of the wage bill in the private and public sectors was very different: In the first case it increased by 10.5%, while in the second it only increased by 4.7% ( Table 2.2 ).
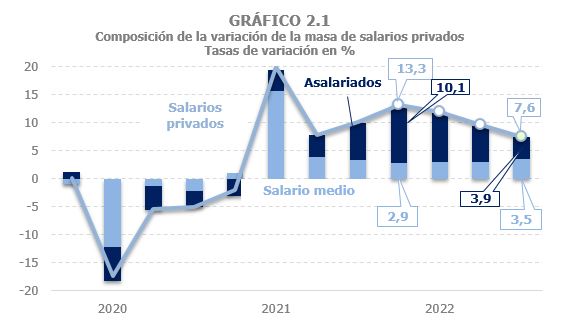
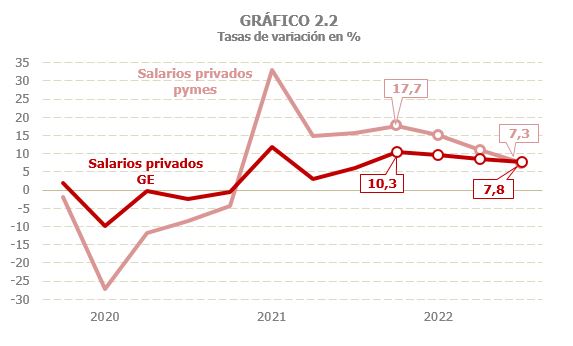
In the private sector, two parts can be clearly distinguished in the year (Chart 2.1). In the first, when the comparison was still made with periods affected by restrictions on activity, the good performance of employment allowed increases of around 12.6% to be recorded. In the second, the gradual slowdown in employment slowed the growth of the wage bill (in the fourth quarter the increase was only 7.6%). Average incomes, on the other hand, showed the opposite profile, with greater increases as the year progressed. The profile was similar in large companies and SMEs, although the slowdown in the wage bill was greater in the latter (Chart 2.2), also a consequence of the comparison in the first part of the year with periods with restrictions that affected small companies more.
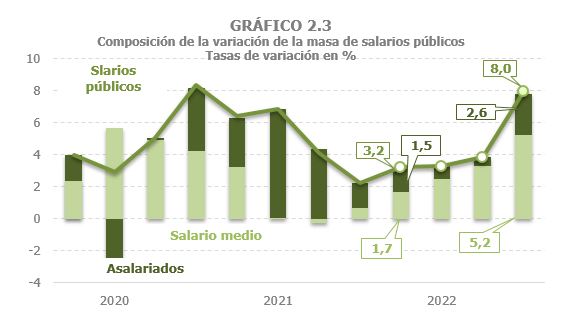
Public sector wages, for their part, grew by 4.7%, a rate similar to that recorded a year earlier, although for different reasons. In 2021, the increase was supported by the greater rise in employment, while average performance remained relatively stable, affected precisely by the entry of new employees with lower average salaries. However, the main reason for the increase in the wage bill in 2022 was higher average salaries. And, unlike what was observed in the private sector, in this case the growth rate of the wage bill increased moderately throughout the year, from 3.2% in the first quarter to 3.8% in the third, rebounding to 8% at the end of the year, when the additional payment was paid in the last quarter to compensate for the rise in prices (Chart 2.3).
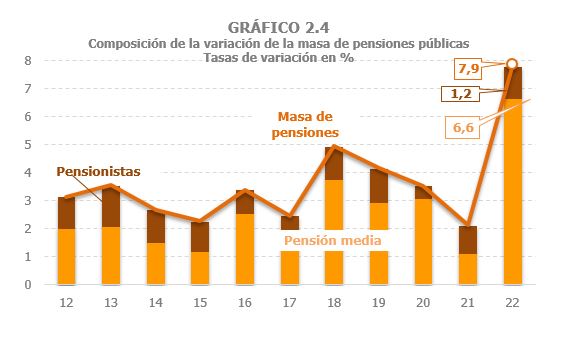
Finally, public pensions maintained growth of around 6.8% throughout the year, following the strong increase in the first quarter due to the compensatory payment received in January for the price deviation in 2021. The average pension grew by 6.6%, an increase that has its origin in the recovery of the loss of purchasing power of the previous year, in a greater annual increase ( Table 2.2 and Graph 2.4) and, as usual, in the upward effect resulting from the incorporation of pensioners with higher average pensions than those already in the system.
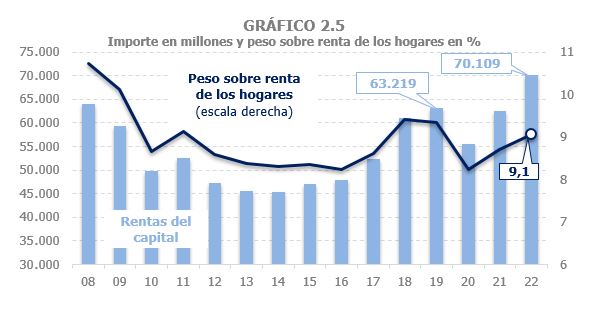
It is estimated that in 2022, household capital income (furniture, rents and capital gains) grew by 12.3%, matching the increase estimated for 2021 and already exceeding pre-pandemic levels ( Tables 2.1 , 2.4 , 2.5 and 2.6 ), although the weight that these incomes then represented in total gross household income has not yet been reached (Chart 2.5).
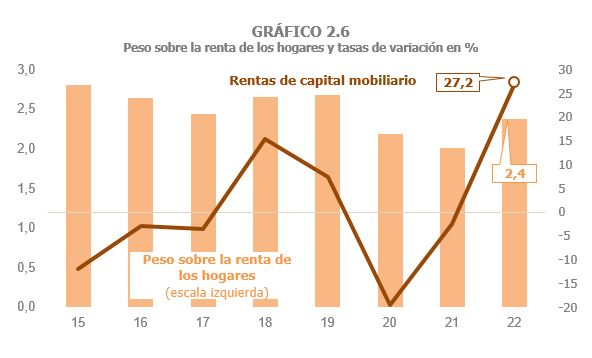
As usual, very different behaviors are observed between the different types of assets. After falling by 2.5% in 2021, capital gains grew by over 27% in 2022 (Chart 2.6), thanks to the good performance of its main component, dividends, which increased by just over 37%, after two years of declines. It is notable, not so much for its amount, but for breaking a trend that has lasted for many years, the gradual recovery of bank account interest in response to the new interest rate situation. Despite this strong growth, the level of capital gains in 2022 was still slightly below that observed before the pandemic.
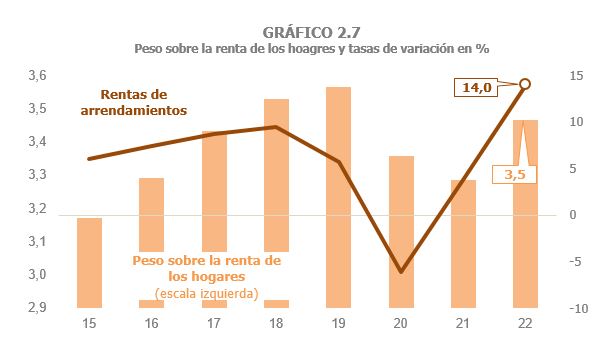
The positive evolution of capital income was also contributed to by the increase in income from property leasing (14% compared to the previous 3.8%), which since 2015 have been the largest contributor to total capital income. In fact, its importance in terms of household income as a whole has been increasing (with the exception of the decline caused by the pandemic). The recovery of these rents was especially intense in 2022, observed both in the leases of premises (which are subject to withholding) and in those of homes. Despite this, they have not managed to match the weight they represented on total household income before the pandemic (Chart 2.7).
Capital gains, for their part, grew by 1.9% compared to the already very high figure for 2021 (in that year the growth was almost 35%). Part of this moderation is related to the profits linked to investment funds, which fell by 20.6% after strong growth in the final stretch of 2021. As for personal business income, it is estimated that it increased by 16.8% in 2022, a very high growth, especially if we take into account the good result they showed in 2021 (31%, Table 2.8 ), when they managed to greatly exceed pre-2020 levels. As with private wages, the profits of these companies grew more rapidly in the first half of the year, as they were highly concentrated in activities that were particularly affected by the restrictions associated with the pandemic and which lasted until the first half of 2021. The disappearance of this comparison effect, as well as the slowdown in activity, meant that growth was lower in the latter part of the year. However, annual growth remains high compared to the average increase observed in previous years (in the period 2013-2019 it was around 6%; in 2019 it was 2.6%).

As for personal business income, it is estimated that it increased by 16.8% in 2022, a very high growth, especially if we take into account the good result they showed in 2021 (31%, Table 2.8 ), when they managed to greatly exceed pre-2020 levels. As with private wages, the profits of these companies grew more rapidly in the first half of the year, as they were highly concentrated in activities that were particularly affected by the restrictions associated with the pandemic and which lasted until the first half of 2021. The disappearance of this comparison effect, as well as the slowdown in activity, meant that growth was lower in the latter part of the year. However, annual growth remains high compared to the average increase observed in previous years (in the period 2013-2019 it was around 6%; in 2019 it was 2.6%).
The effective rate on gross household income increased by 4.6% ( Table 2.1 and Chart 2.9). The increase in the rate was due to the increase in average incomes in salaries and pensions, in turn caused by the revisions derived from the inflationary process that began at the end of the previous year and, in the case of pensions, by the incorporation of new pensioners into the system with higher average pensions. In addition, unemployment benefits, which have almost zero average rates, continued to lose importance, which also pushed up the total effective rate.
The accrued personal income tax grew by 13% in 2022 ( Table 2.1 ) after increasing by 11.9% in 2021. Such a high rate has not been recorded since 2006. This increase is the result of an increase in the bases by 8.1% and in the rate by 4.6%.
Withholdings on income from work and economic activities increased by 12.4% ( Table 2.3 ). This positive development was supported by the good performance of income, which increased by 7.3% and by the increase in the effective rate by 4.7% (Chart 2.10). The importance of both factors, however, varies depending on which retention is being analyzed. Thus, the main reason for the 11.6% increase in wage withholdings was the 9% increase in the wage bill. The increase was again greater in private sector withholdings (13.6%), with strong increases both in Large Companies (12.6% compared to 5.1% in 2021) and in SMEs (15.7%, a rate similar to that achieved the previous year). Withholdings on public sector wages grew by slightly less, 7%, due to a more moderate growth in the wage bill (4.7%). The rate increase explains about three points of the increase in withholdings in the case of private salaries and around two points in public salaries. As for pensions, the rate increase was around 9%. This, together with the increase in income, caused withholdings to grow by 17% in the year.
As regards company withholdings, both the split payments and the withholdings on economic activities increased at a good pace for the second year (17.7% for the former and 10.9% for the latter), thanks to the positive evolution of the profits of personal companies.
Withholdings on capital income increased by 17.6% ( Table 2.1 ). The increase was particularly strong in withholdings on capital gains (27.2%), but it was not enough to recover the level reached in 2019. Withholdings on leases, mainly for commercial premises, rose by 11.5%, more than double the rate recorded the previous year, already matching the level recorded in 2019. For its part, withholdings derived from capital gains from investment funds fell by 20.6%, following the strong growth experienced in the previous two years.
Income from income tax increased by % (compared to 7.5% in 2021), a rate that exceeds by almost three points the rate achieved by accrued taxes, thanks to the good result of the annual declaration associated with the 2021 financial year and paid in 2022. The positive share increased significantly (25.4%) due to the growth in income not fully subject to withholding or payment on account (income from business activities and capital gains), in addition to the effect of regulatory changes (increase in rates on the savings base and modification of the limits on contributions to pension plans) approved in the 2021 PGE. Income from withholding taxes on work and economic activities grew by 12.6%, doubling the rate achieved the previous year. The increase in the private sector was slightly higher than in the public sector (12.9% and 11.7% respectively). Within the first, income associated with SMEs was the most dynamic, with an increase of 17.3% compared to 10.7% for Large Companies. It should be noted that the transfer to the cash register had a different impact depending on the type of company. Thus, the income of Large Companies grew two points below their accrued withholdings, as the withholdings corresponding to December 2022 were shifted to 2023, which performed better than those associated with December 2021 and collected in 2022. And the opposite occurs with SMEs, where the income associated with the accrual of the last quarter of 2021 and received in 2022 was higher than that linked to the accrual of the last period of 2022, which was shifted to the following year.
In terms of income from PA withholdings, those from salaries grew by just over 6%, while those from pensions rose to 18.3%. As already mentioned, the growth of the average wage increased as the year progressed, with this trend becoming more acute in the fourth quarter, when the additional payment was included to compensate for the rise in prices. The increase in the average rate resulting from the higher average salary, together with the growth in employment, make up the growing profile of income from withholdings on public salaries. In pensions, on the other hand, the collection was higher in the first quarter, collecting the income associated with the compensatory payment for the price deviation in 2021. Following the strong record in the first quarter, these withholdings remained high throughout the year, as a result of the higher average pension and the subsequent increase in the effective rate.
The second element that explains the positive evolution of income tax revenue was the high growth experienced by income from the annual declaration, which contributed some 3.3 billion more than the previous year. The reasons for this result are two: the effect of regulatory measures (increase in rates on the savings base and modification of limits on contributions to pension plans, which totalled 691 million euros, primarily affecting taxpayers with a positive differential rate) and higher growth in income not subject to withholding and in the upper ranges of the distribution. As for refunds, those linked to the annual declaration decreased by 1.6% and, within these, those associated with refund requests for the 2021 Income Tax Campaign fell by 2.4% compared to those linked to the previous campaign.
As was the case in 2021, the good performance of SMEs in 2022 was also observed in the fractional payments of personal companies, which grew by 21.7%, exceeding the income of the previous year by 716 million. This figure is quite remarkable, especially considering that in 2021 they already grew by more than 17%, and that in the years in which this variable has had a favourable evolution, the increases compared to the previous year were around 200 million.
Income from withholding taxes on movable capital grew by 9.5%, well below the accrued withholdings, weighed down by lower dividend income associated with the accrual in December 2021 and received in 2022. The growth in revenue in 2021 and 2022 was not enough to offset the loss suffered during the pandemic, so the level reached by these withholdings in 2019 has not yet been recovered. The same does not apply to income from withholding taxes on leases, which after growing by 11.3% in 2022 have already exceeded the pre-pandemic level. Income from investment fund withholdings fell by 10.8%, following the strong growth recorded the previous year. Despite the decline, their levels remain very high, as they exceed by around 400 million the average income obtained by this figure in the period 2014-2020 (almost 73% more).
Finally, it should be noted that in 2022 the usual pattern of the annual settlement of the Allocation to the Catholic Church was broken again. This settlement was usually made in January for the outstanding balances from the declaration from two years prior. However, the 2021 tax, which should have been paid in January 2023, was brought forward to December 2022. In addition, in 2021 the returns associated with the Allocation to the Catholic Church were lower than normal, since the settlement corresponding to 2019 was also brought forward to December 2020. The consequence of both movements was that the returns for this concept in 2022 exceeded by more than 240 million those made a year earlier, negatively affecting income.