4. Valued Add Tax
In 2022 VAT revenues grew by 13.9% reaching 82,595 million.
The predominant note throughout practically the entire year was the notable increase in gross income (20.4%) accompanied by a considerable increase in refunds made (36.7%), in this case due both to the increase in monthly requests and to the faster pace of completion that occurred in the last part of the year (Chart 4.1).

The result is conditioned by the reductions in the VAT rate applicable to electricity consumption in contracts with contracted power less than 10 kW and in natural gas consumption. Measures on electricity consumption were already in force in 2021, but not throughout the year and not with the same intensity. The growth would be 16% if the revenue lost due to these measures is added and 19.4% if the negative impact on revenues of the speeding up of refunds mentioned above is also corrected. In any case, the rates are much higher than the increase in prices in the same period (between November 2021 and October 2022, the months included in the collection, the general CPI rose, on average, by 8.4%), which indicates that the growth was not only a consequence of the rise in prices, but also of the intense recovery in consumption.
final expenditure subject to VAT closed the year with a growth of 14.2% ( Table 4.1 ). As with other figures, the increase was considerably higher in the first half of the year (20.5%), favoured by the comparison with a period in 2021 partially hampered by some limitations on activity and by an inflationary process that became more acute in that part of the year. This explains why spending slowed in the fourth quarter. For that quarter, spending is estimated to have increased by 4.4%, which contrasts with the rate for the first half of the year and even with the 13.5% for the third quarter (Chart 4.2). Excluding price increases, spending would rise by around 5.5% this year.

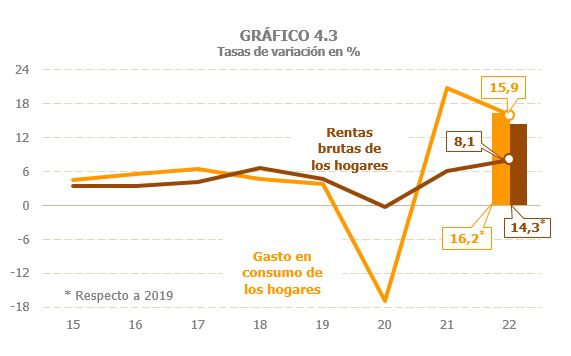
As in the previous year, household consumption expenditure was the component that grew the most in 2022 (15.9%), after having suffered the greatest decline due to the pandemic. Despite this, it did not manage to recover the weight it had on the total expenditure subject to it, remaining still slightly below the average observed in the period 2016-2019. Nor has the balance that used to be observed between the evolution of gross household income, which grew by 8.1%, and consumer spending, which increased by almost twice as much, by 15.9%, been fully recovered. This harmony was broken in 2020, when spending was sharply affected by confinement and other limitations, without benefiting from other factors that cushioned the fall, as was the case of gross household income, favoured by the compensating role played by income from public sources (wages, pensions and other benefits, including transfers derived from ERTE). However, if the comparison is made with respect to 2019 levels, this gap narrows considerably: Gross household income grew by 14.3% while spending grew by 16.2% (Chart 4.3). Housing spending grew strongly again (12.5%), while government spending, which was the only component that increased in 2020, thanks to the greater outlay associated with dealing with the effects of the pandemic, increased by 4.6% in 2022, compared to 7.3% reached the previous year ( Table 4.1 and Chart 4.4).

The VAT rate is estimated to have remained virtually unchanged ( %, Table ), despite regulatory changes affecting rate: the reduction of the VAT rate on electricity (from 21% to 10% until June 2022 and a new reduction from 10% to 5% from July), the reduction of the VAT rate from 21 to 5% applicable to natural gas, the wood and pellets, the maintenance of the rate reduction on surgical masks and type 0 on essential health materials to combat COVID 19, vaccines and PCR and the rate increase on sugary and sweetened beverages. The impact of these measures, valued at 1.38 billion ( Table 1.5 ), favoured the decrease in the average rate.
The evolution of the effective rate is also influenced by the type composition of the final expenditure subject to tax ( Table 8.7 ). In the period from 2015 to 2019, the weight of general-rate expenditure on the total final subject expenditure remained around 57%, increasing to 58.7% in 2020. In that year, the weight of super-reduced spending also increased, although to a lesser extent, all at the expense of reduced-rate spending (associated, among others, with the sectors most affected by confinement measures and other limitations), which fell by three points. In 2021, this situation was partially reversed, with the additional contribution of the reduction in the electricity rate during half of the year, so that consumer spending at a general rate had a weight similar to that observed before the pandemic. Information for the 2022 financial year will be available at the end of 2023.
Given the changes in final subject expenditure and the effective rate, the VAT accrued in the period increased by 13.8%, which is the same rate expected for net accrued VAT (which differs from the previous one because it includes the variation in the balance that companies leave to offset from one year to the next).
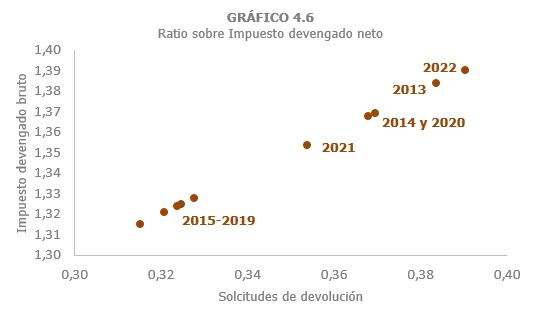
As already noted, gross VAT accrued grew strongly, by 16.9%, an increase that is even more noteworthy if one takes into account that it occurs on a level that had already far exceeded (by more than 4.9 billion) the amount prior to the pandemic ( Table 4.2 ). Furthermore, the inflationary process that began at the end of 2021 and continued throughout 2022 has been passed on to costs, causing a sharp increase in refund requests. All this has resulted in an increase in the ratios of gross VAT accrued/net VAT accrued and refund requests/net VAT accrued, so that these ratios are the highest observed in the last ten years (Chart 4.6).
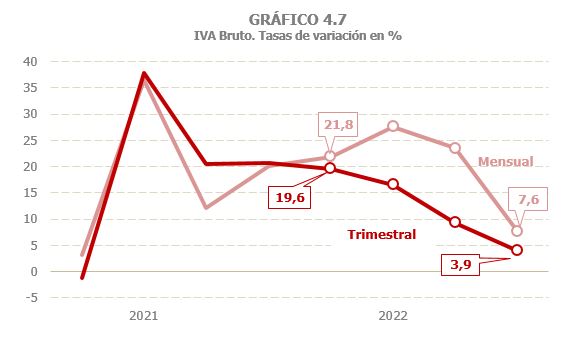
The slowdown in spending throughout the year has affected the evolution of gross VAT accrued, although in a different way depending on the type of declarant. Thus, the monthly declarations, which group together Large Companies, groups and other operators covered by the monthly refund regime, together with import VAT, continued to show a growing profile during the first semester, with increases of around 25%. average, the rate of advance reducing slightly in the third quarter to fall sharply in the fourth, to 7.6% (Graph 4.7). Quarterly statements, for their part, have shown a slowdown since the beginning of the year, which has become more evident at the end of the year.
Gross revenue increased by 20.4%, three and a half points more than gross VAT accrued (16.9%, Table 4.2 ). This greater increase has two causes. On the one hand, the mechanics of the tax itself mean that practically all of the income for the first quarter of 2022 corresponds to accruals from the end of 2021, with a growth much higher than the accruals for the last quarter of 2022, the income of which is mostly transferred to the first quarter of 2023. That is to say, cash income was barely affected by the period of more intense slowdown, which did affect accrued tax. The second reason for the higher growth in gross income is the 8% increase in revenue associated with the requested deferrals, compared to the 10.9% drop recorded in 2021, a consequence of the comparison with the high level reached by this concept in 2020 due to the payment deferral measures that were taken in the early stages of the pandemic.
Refund requests increased by 25.5%, after growing by 14.4% in 2021. Of the 6.951 billion new applications, 6.6 billion were due to monthly declarations (the largest increase observed since records began). These applications, more commonly related to exports, although in 2022 they were also conditioned by price increases, grew by 31.3%, linking two years of strong increases. Annual refund requests, which are more closely linked to the reduced rates at which smaller companies sell, rose 5.7%, compared with 17% the previous year.
VAT refunds made grew by 36.7% in 2022, with strong progress both in annual refunds, which increased by 18.9%, and in monthly refunds, which rose to 46.9% (around €8.8 billion more than those paid in 2021). The growth in regional adjustments was also high (13.6%), although it did not reach the intensity of the previous year. The increase in annual refunds is due to the higher amount requested in the 2021 financial year, most of which was paid in 2022, coupled with a high rate of realization, which exceeded the already high rate recorded in the previous year (you have to go back to 2008 to find a higher rate of realization). Both factors also come together in monthly returns: the highest amount requested in the 2022 financial year and an upturn in the pace of implementation, which exceeded by almost eleven points the one achieved in 2021 and by more than four points the pace of implementation observed between 2012 and 2020.