2. Personal Income Tax
In 2023 the income in the PIT amounted to 120.28 billion, which meant a growth of 9.9% and, of the almost 16.5 billion of higher total income, 10.795 corresponded to the I PIT. Once again, the positive development of employment, coupled with the increase in average wages and pensions and the subsequent rise in the effective rate, were the main factors that explained the good performance of income. All these factors led to a significant increase in tax withholdings on work income, which was limited, however, by the reduction in taxes on the lowest incomes (which resulted in a loss of income of more than 1.7 billion). In addition to these withholdings, in 2023 the contribution of withholdings on movable capital also stood out, with a large increase thanks to the good performance of dividends and the recovery of income from withholdings on bank account interest driven by the rise in interest rates.
household income increased by % (Table , more than one point higher than the rate achieved in the previous year. Growth was higher than in 2022 in employment income, in capital gains, in capital gains not subject to withholding tax and in business income, and lower than in 2022 in rental income and in profits from investment funds. For the third consecutive year, private sector wages have increased significantly, albeit less sharply than in the previous year. Public revenues, on the other hand, more than doubled due to the greater increase in both the wage bill and the pension and unemployment benefits bill.
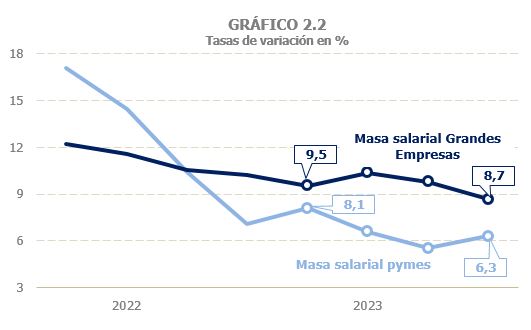
Labor income, the main component of household income, grew by 7.9% in 2023, a rate more than half a point higher than that achieved in 2022 (7.3%, Table 2.1 ). The behavior of its different components was uneven. Wages increased by 7.6%, losing two points compared to the 9.6% recorded a year earlier ( Table 2.2 ), as a result of the evolution of the wage mass in the private sector, which grew by 8.3% compared to 11.4% the previous year. These incomes maintained during the first half of 2023 an increase similar to that of the end of 2022, around 8.8%, thus slowing down the downward trend that had been observed since the beginning of the previous year, as a result of the slowdown in job creation (Chart 2.1). During this period, the slower growth in employment was offset by the higher increase in average wages. However, in the second half of the year, a gradual moderation of the wage bill was observed again, as the slowdown in employment was accompanied by a lower increase in the average wage. In large companies this slowdown was less intense than in SMEs (Chart 2.2).
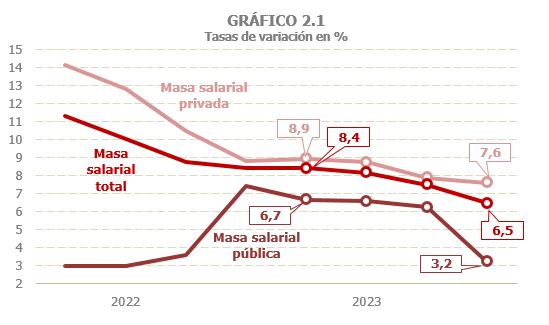
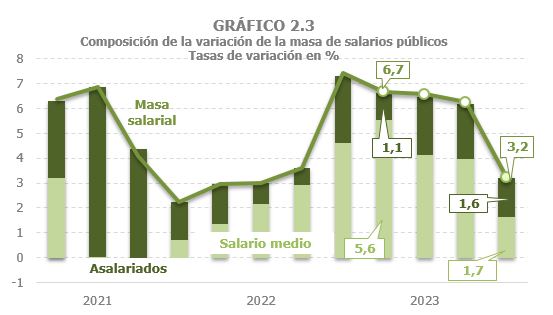
For its part, the wage bill in the public sector increased by 5.6% (4.4% in 2022). Growth was relatively stable at around 6.5% until September, but in the last quarter there was a sharp moderation (3.2%, Charts 2.1 and 2.3) when compared with the fourth quarter of 2022, which included the additional payment received then to compensate for the rise in prices (in 2023 there was also an update, but of a much smaller amount). The rise in wages is explained by an increase in employment of just under 2% and, above all, by the increase in average wages, estimated at 3.7%. The growth of these average incomes gradually moderated as the year progressed, standing at 4.5% on average until September, but falling sharply in the fourth quarter due to the aforementioned comparison effect with 2022.
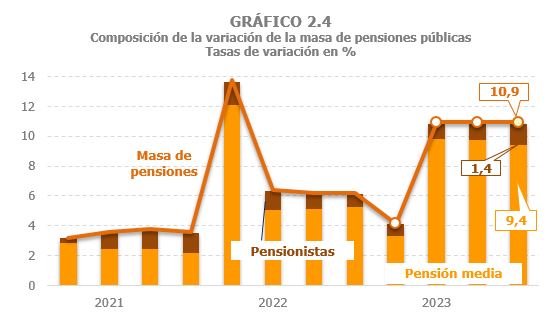
The growth of the public pension fund reached 9.4%, exceeding by 1.5 points the already high figure for 2022 (7.9%) and thus linking two years of strong increases. It should be noted that the 2023 rate is subject to a downward trend due to the sharp drop recorded in January, when compared to the same month in 2022, which included the compensatory payment received then for the price deviation in 2021. If only the growth between February and December is considered, the increase was even greater, 11% (Table 2.2and Graph 2.4). As regards private pensions, they were reduced again, although to a lesser extent than in previous years.
Finally, as regards labour income, unemployment benefits increased by 3.2% in 2023, after two years of declines following the COVID crisis, due both to the greater number of unemployed covered and to the increase in the average benefit. The level of these benefits (15,563 million) remains slightly above the average recorded in the period 2014-2019 ( Table 2.2 ).
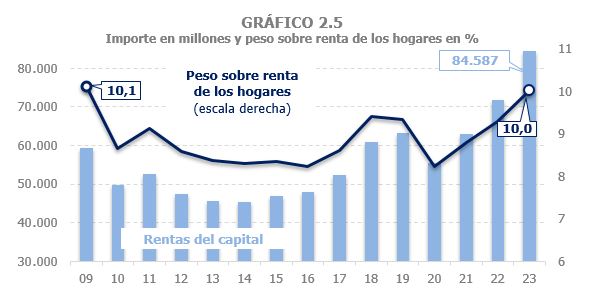
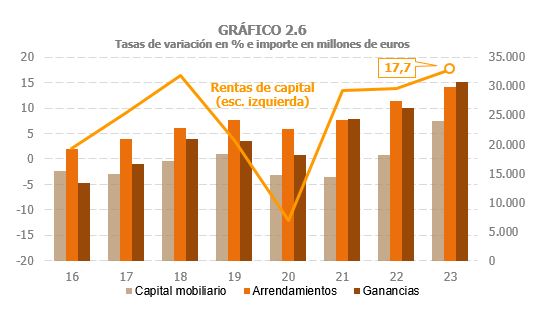
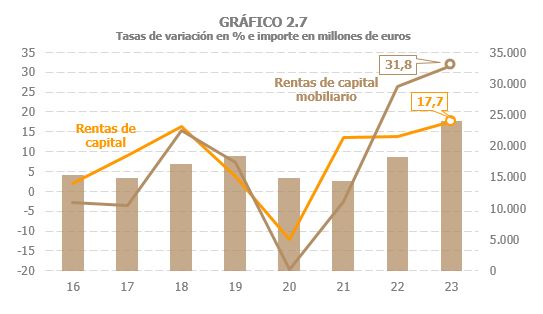
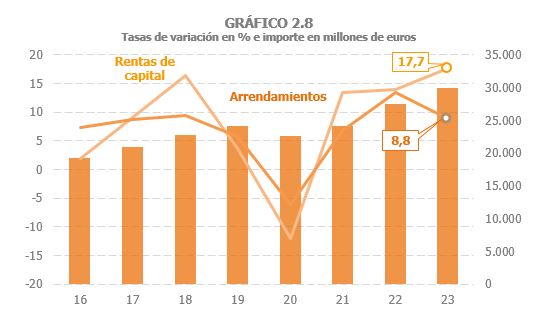
Household capital income (furniture, rents and capital gains) is estimated to have grown by 17.7% in 2023, four points above the increase observed in the previous two years (13.9% in 2022 and 13.5% in 2021), thus exceeding the weight that these incomes represented in total gross household income before the pandemic ( Tables 2.1 , 2.4 , 2.5 and 2.6 ). In fact, these incomes have not had a similar weight (10%) since 2009 (Chart 2.5).
In 2023, very different behaviors were observed between the different types of assets. Capital gains account for a large part of the higher growth in total capital gains in 2023, increasing by 31.8% (29.7% of those subject to withholding tax) and thus accumulating two years of strong increases (Charts 2.6 and 2.7). All the components of these incomes show a positive evolution, although it is worth noting the significant advance experienced in 2023 by income associated with bank account interest, as a result of the rise in interest rates, so that at the end of the year its average level already exceeded that observed in 2015. Income from dividends also performed well, although below the increase observed in 2022.
Likewise, rental income, which grew by 8.8%, made a positive contribution to the increase in capital income. Growth was, however, more than four and a half points lower than a year earlier (13.4%, Chart 2.8). The loss of intensity in 2023 meant that these incomes, which since 2015 were usually the ones that had the greatest weight in total capital income, gave up their position in favour of capital gains.
Capital gains are expected to increase by 17.1% in 2023, which would represent an acceleration of 10 points compared to the 2022 figure. The reason for this favourable development is the good performance of profits not subject to withholding, as profits linked to investment funds fell by almost 40%.
As for personal business income, it is estimated that it grew by 10%, almost two points higher than the 8.2% observed in 2022 ( Table 2.8 ). The growth of these incomes slowed down as the year progressed, going from 12.3% in the first quarter to 8.1% in the last. Despite this slowdown, it should be noted that at the end of 2023 they were still maintaining growth rates two points above the average rate for the 2013-2019 period, which was around 6%.
The effective rate on gross household income increased by 2.8% (3.7% in 2022). Without the differential quota, the increase is estimated at 1.3%, an increase three and a half points lower than that recorded a year earlier (Table 2.1and Graph 2.9). Higher average salaries and pensions explain the rise in the rate, which would have been higher had the rate for the lowest incomes not been reduced. Furthermore, the fact that unemployment benefits, with almost zero average rates, were gaining weight in the total income, also pushed down the total effective rate.
HePITaccrued grew by 12% in 2023 after increasing by 11.9% in 2022 and 2021, thus chaining three years of high growth. Without the differential fee, the PIT accrued increased by 10.4%, as a result of the increase in the bases by 9% and the rate by 1.3% (Table 2.1).
Withholdings from accrued work and economic activities increased by 10.2%, due to the growth in returns (7.1%) and the higher average rate (2.8%, Table 2.3 and Chart 2.10). The withholdings linked to wages, the main component of these withholdings, increased by 9.3%, thanks to the good performance of the wage bill (7.6%) and a moderate growth of the average rate (1.6%), which was affected downwards by the decrease in the rate for the lowest incomes. The increase in the effective rate was similar in the private and public sectors, so the growth in withholdings associated with private salaries was higher than that observed for the public sector, in line with the evolution of the bases. Furthermore, rates increased less as the year progressed, which intensified the deceleration profile of accrued withholdings. Within the private sector, the rate cut had a greater impact on SMEs, so the slowdown was more intense in this group. In public pensions, the rate increased by 7.5%, which, together with the increase in income, caused withholdings to grow by 17.6% in the year (close to 19% if January is not taken into account, atypical for the reasons indicated in income).
As regards withholdings on economic activities, their growth in 2023 was considerably more moderate than the previous year (2.9% compared to 10% in 2022) due to the negative evolution of sales by agricultural entrepreneurs and the lower growth in gross income of professionals ( Table 2.3 ). For their part, split payments increased by 8.1%, almost two points below the company's income as a result of regulatory changes (increase in the percentage of expenses that are difficult to justify in the direct estimate mode and reduction in net income in the objective estimate).
Withholdings on capital income increased by 18.1%, a high rate similar to that reached the previous year ( Table 2.1 ). The main reason for this trend was the sharp increase in withholding taxes on capital gains (29.7%), which, after two years of sharp increases, reached levels not reached since 2013. All the components of these withholdings increased in 2023, although, as already mentioned, it is worth highlighting the sharp rise in withholdings derived from bank account interest, as well as the good performance of dividends. Withholdings on leases, mainly for commercial premises, rose by 6.3%, about four points below the rate recorded the previous year. For its part, withholdings derived from capital gains from investment funds fell by 39.1%, thus marking the lowest level in the series (231 million) since these withholdings were introduced in 1999.
The second largest contribution to the growth of the tax was made up of withholdings on income from movable capital, which grew by 26.7% thanks to the good performance of dividends and the recovery of income from withholdings on interest from bank accounts.
Split payments from personal companies also made a positive contribution to total tax revenue. Tax revenue grew by 7.6% in 2023. If the losses due to regulatory measures are added ( Table 1.5 ), the growth would be almost 10%, which is the increase estimated for the income of these companies. Its profile throughout the year was, as happened with other variables linked to the SMEs , one of deceleration after a good start to the year inherited from the good results that characterized the entire previous year. In any case, the split payments, which during the pandemic and in the following years have been affected both by the economic situation in the sectors where there is a greater presence of personal companies and by the multiple measures that have tried to soften their consequences, were almost 40% higher in 2023 than those recorded in 2019.
Income from withholding taxes on leases grew by 6.7%, showing a gradual deceleration profile (they started the year with growth close to 8% and closed it with an increase of 5.5%). For its part, income from withholdings on capital gains in investment funds fell by 44.7%, a greater drop than that observed in accrued tax, as the good record accrued in December 2023 was transferred to the 2024 cash flow.
Finally, it should be remembered that in 2022 the usual pattern of the annual settlement of the Allocation to the Catholic Church was broken again. This settlement was usually made in January for the outstanding balances from the declaration from two years prior. However, the amount corresponding to the 2021 financial year, which should have been paid in January 2023, was brought forward to December 2022. This is why the refunds for this concept in 2023 were around 230 million lower than those made a year earlier.
The income in the PIT increased by 9.9% (compared to 15.8% in 2022), more than two points below the rate reached by accrued taxes. The main reason for this divergence is that the latter include the estimate of the accrued differential fee corresponding to the 2023 financial year, while the cash income includes the income and returns corresponding to the result of the annual declaration for the 2022 financial year. In this case, although the positive share increased by 7%, due to the growth of income not fully subject to withholding or payment on account (real estate income, business activities and capital gains), the returns registered a significant increase, exceeding by almost 1.7 billion those made the previous year. As a result, net income was around €500 million lower than in the previous year. Behind this result are the downward corrections of the regional rates and the increase in the family minimums and the deductions also in the regional section of the tax, changes that meant a loss of income of 1,677 million ( Table 1.5 ). It should be noted that withholdings are calculated using a general rate and that any change in the parameters of regional competence means a decrease in positive differential rates or an increase in negative differential rates.
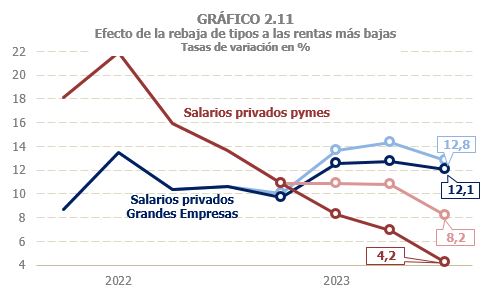
Withholdings on income from work and economic activities grew by 11%, 12.6% for those from the AA.PP. and 10.3% in the private sector ( Table 2.3 ). The difference in the behaviour of each sector is determined by the sharp increase in withholdings linked to pensions, which have grown by around 19% since March (in February they were compared to a month that had the last update payment). This increase occurred despite the effect of the rate cut on the lowest pensions. This impact was also felt by SMEs, whose income from withholdings grew by 7.7% (without the rate cut, growth would have been 10.2%). In large companies the reduction was less significant (Chart 2.11), but sufficient to reduce revenue growth by one point (they grew by 11.7%, but without the reduction they would have increased by 12.7%). Finally, in the withholdings derived from public salaries, the increase in 2023 was slightly higher than 8%.