4. Valued Add Tax
In 2023 the income from the VAT grew a moderate 1.6%, reaching 83.909 billion. Final expenditure subject to tax increased by 7.1%, but the impact of regulatory and management measures (rate cuts, but also changes in the conditions for requesting deferrals) meant that the increase in expenditure did not translate into higher revenues. ( Table 4.1 ).
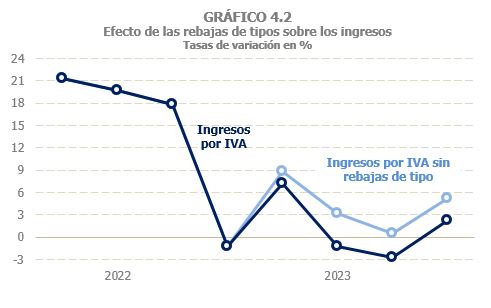
There are two main features to highlight in the evolution of revenues in this tax compared to 2022, a year in which revenues grew by almost 14%. On the one hand, subject expenditure, although it grew at a high rate compared to the rates observed before 2020 (between 2014 and 2019 the average was 4.8%), suffered a notable slowdown compared to the previous year, related, above all, to the progressive relaxation of inflationary tensions that had been so acute in 2022 (Chart 4.1). On the other hand, it should be remembered that the tax was significantly affected by the rate reductions on basic food products, the additional reductions applicable to electricity consumption in contracts with contracted power less than 10 kW and to natural gas consumption, in addition to the rate reduction on feminine hygiene products and contraceptives. These reductions subtracted 2,452 million from revenues ( Table 1.5 ), further exacerbating the revenue deceleration profile (Chart 4.2). Excluding the impact of these shocks, revenues would have grown by 4.6%. If we also discount the impact of other factors such as the change in the deferral regulations and the existence of extraordinary refunds, which would increase the lost income to more than 3 billion, the growth would rise to 5.3%, more consistent with the evolution of spending, and even more so if we take into account that the rate cuts have an immediate impact on gross income, but a delayed impact on the refunds made.
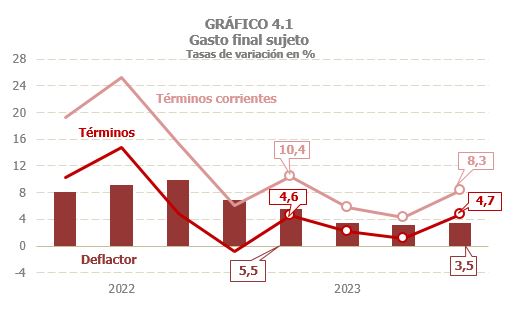
He final expenditure subject to VAT closed the year with a growth of 7.1%, which represented a loss of almost nine points compared to the rate estimated for 2022 (Table 4.1). Part of the slowdown in nominal spending was due to lower price increases (Chart 4.1), which resulted in an increase in the spending deflator of less than 4%, compared to 8.4% in 2022. But there was also a moderation in spending in real terms, with growth of 3.2%, almost four points less than the previous year, although it should be remembered that 2022 was compared to 2021, which had not yet returned to normality in all activities (on average for 2022 and 2023, spending growth in real terms is slightly higher than the average for the period before the pandemic).
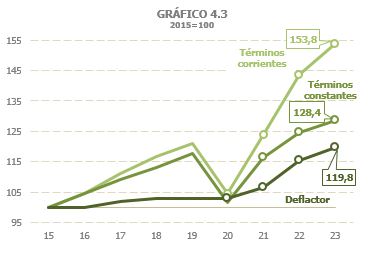
The notable effect that the inflationary cycle that began in 2021 has had on nominal spending can be clearly seen in Chart 4.3, which shows the evolution of spending based on 2015. It can be seen how, until 2020, the evolution of expenditure in current and constant terms showed the same profile, given the moderation of prices at that stage. Thus, in 2020 nominal spending was 4.4% higher than that achieved in 2015, and spending in constant terms was 1.5% higher than that recorded that year. However, from 2021 onwards, the evolution of nominal expenditure will move away from expenditure in constant terms, so that, while the latter exceeds the amount reached in 2015 by 28.4% in 2023, the increase in the former will rise to almost 54%.
It should be remembered, however, that the impact of prices on spending is not the same as that observed on income for two basic reasons. The first is that not all goods and services included in expenditure are reflected equally in income, given the existence of very different types. Thus, the strong growth in prices of goods or services that are at reduced rates directly affects spending, but its effect is cushioned in income. The second is that in recent years measures have been put in place that have lowered rates on products with the highest price increases, so that their impact on income has been reduced or, as is the case with basic foodstuffs, even eliminated.
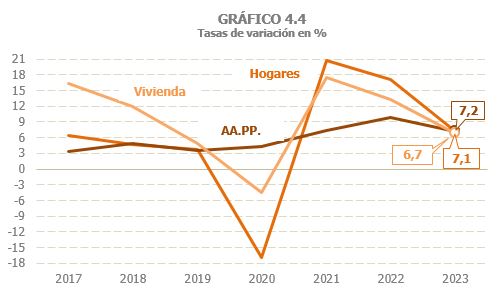
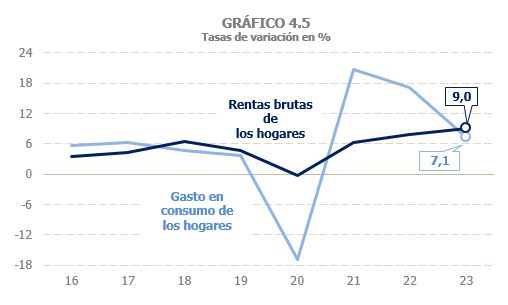
From the component point of view, household consumption expenditure, which is the expenditure group with the greatest weight in the total, was the one that registered the most intense slowdown (7.1% in 2023, 17.2% in 2022), followed by expenditure on home purchases (6.7% versus 13.3%). The sum of current and capital expenditure of Public Administrations was the component with a relatively more stable profile (Chart 4.4), standing at 7.2% after 9.8% in 2022 ( Table 4.1 ). In 2023, the harmony that used to be observed between the evolution of gross household income, which grew by 9%, and their consumption expenditure (Chart 4.5), will be recovered. This harmony was broken in 2020, when expenditure was sharply affected by confinement and other limitations, without benefiting from other factors that cushioned the fall, as was the case with gross household income, favoured by the compensating role played by public income (wages, pensions and other benefits, including transfers derived from the ERTE ).
It is estimated that the effective rate of the VAT was reduced by 4.4% (Table 4.1) as a result of regulatory changes that affected the type: the reduction of rates, from January 1, on food (to 0% on products that were taxed at the super-reduced rate of 4% and from 10% to 5% on oils and pasta), the reduction of rates on feminine hygiene products and contraceptives (from 10% to 4%) and the maintenance of the reduction of the rate of VAT in electricity, natural gas, wood and pellets (from 10% to 5% from mid-2022).
Table 8.7shows the breakdown of the expenditure subject to types (information for the year 2023 will be available at the end of 2024). The weight of general-type expenditure on total final expenditure subject to tax remained relatively stable at around 57% in the period 2015 to 2019. In 2020, it increased to 58.7%, as did, although to a lesser extent, the weight of super-reduced rate spending, all at the expense of reduced rate spending, linked to the services most affected by the confinement measures and limitations on activity. In 2021, this situation was partially reversed, with general-rate spending returning to a similar weight to that prior to the pandemic, despite the reduction in the rate, from the general rate to the reduced rate, for electricity during half of the year and for gas since October. In 2022, the percentage of general rate expenditure fell again to 54.3%, as reduced rate expenditure normalised and electricity and gas consumption continued at reduced rates (initially at 10% and from June at 5%). In 2023, with the reduced rates for electricity and gas still in place, it is expected that the weight of
general rate expenditure will remain the same.
He VAT accrued During the period, it grew by 2.4%, more than four and a half points below the subject expenditure, due to the reduction in the rate resulting from the discounts on food, electricity and gas. A similar rate is expected for the net VAT accrued (which differs from the previous one because it includes the variation in the balance that companies allow to be offset from one year to the next).
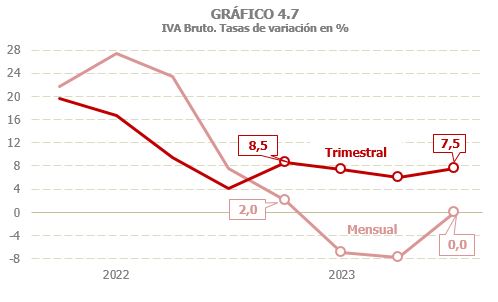
He VAT gross earnings closed the year at practically the same level as the previous year (Table 4.2). After starting at 4% in the first quarter, on the path of gradual slowdown that began in 2022, it fell by around 3% in the central quarters and recovered to 2.5% in the final stretch. In Large Companies the VAT gross was reduced by 3.3% while in the SMEsan increase of 7.3% was observed (Chart 4.7). The reason for this divergence is the way in which rate cuts are implemented, especially those related to electricity and gas, activities where large companies predominate. Initially, the rate is reduced, reducing the gross income of these companies. Subsequently in the quarterly statements of the SMEsThese lower incomes mean a lower VAT supported and, consequently, increase the income in these other companies.
Furthermore, it should be noted that in 2023 the conditions for requesting deferrals were improved. This caused the amounts of the VAT gross not entered (due to postponement, recognition of debt with request for compensation or impossibility of payment) and, therefore, that the VAT accrued with income key was reduced by -1.4%. For the purposes of the VAT accrued is a simple redistribution between some keys or others, but it has consequences in the way in which the accrual is transformed into cash by deferring over time part of the income that, otherwise, would have been entered in the year.
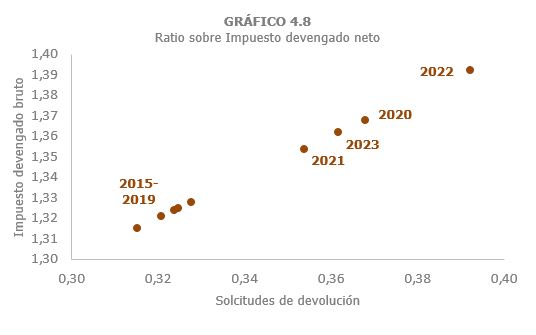
The disparate behaviour that occurred between Large Companies and SMEs in gross income was also observed in refund requests, with a monthly decrease of 9.3% and an annual increase of 10.1%. The total amount requested decreased by 5.7%. All this has resulted in a drop in ratios VAT gross earned / VAT net accrued and refund requests / VAT net accrued, returning to the levels observed in 2021, after the maximum recorded the previous year, as a result of the sharp rise in energy prices that was passed on to costs, causing a sharp increase in refund requests (Chart 4.8).
Cash grew 1.6%. Gross revenue remained stable in 2023, as did the VAT gross accrued (Table 4.2), although the slowdown in revenue from self-assessments was greater than that from accruals, especially in quarterly self-assessments, a fact that can be explained by the mechanics of the tax itself, due to the transfer of the last accruals to the following year's cash. Thus, almost all of the income for the first quarter of 2023 corresponds to accruals from the end of 2022, with a lower growth than the accruals for the last quarter of 2023, the income of which is mostly transferred to the first quarter of 2024. On the other hand, the revenue associated with deferrals increased by 11.9%, as it included part of the higher deferrals requested that were paid before the end of the year. Deferred revenue from this change and not collected in 2023 is estimated to have amounted to 285 million ( Table 1.5 ).
Returns made from VAT fell by 3.8% in 2023, which is low compared to the nearly 6% decline in refund applications. The drop was due to a 6.7% decrease in monthly rates, while annual rates increased by 6.3%. The tax adjustments also decreased (-1.8%, including refunds associated with imports). The decrease in monthly refunds was a consequence of the lower amount requested in the 2023 financial year and the reduction in the amounts from the previous financial year (in 2022, the percentage of refunds made in the same year of the request was substantially improved). The increase in annual refunds was due to the higher number of applications in the 2022 financial year, which were mostly paid in 2023, and to the existence of extraordinary refunds.