The economic climate
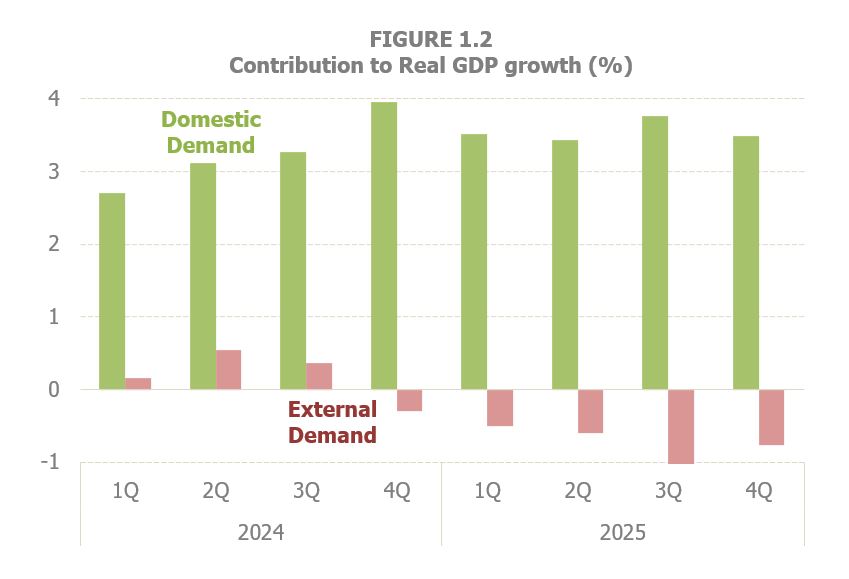
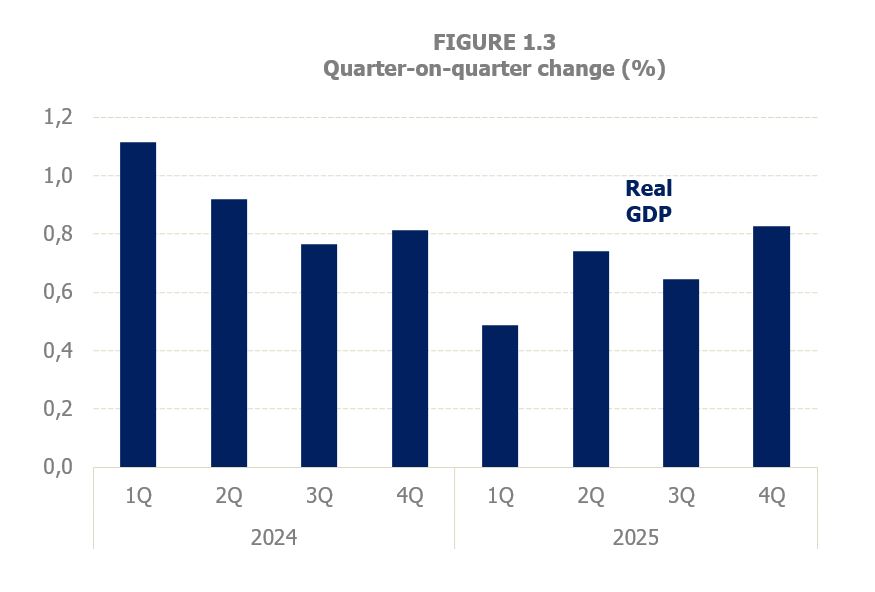
Economic activity, in annual terms, showed a slowdown profile. The chain index measuring changes in GDP in terms of volume grew by 2.8% in 2025, seven tenths less than in 2024 (Table 1.1). Year-on-year rates gradually slowed, from 3.7% in the last quarter of 2024 to 2.7% in the second half of 2025 and 2.8% in the year (Figure 1.1). The unfolding weakness in external demand was the driver of feebler real GDP growth as the year progressed (Figure 1.2). The downturn observed in the year is nuanced when looking at quarter-on-quarter rates (Figure 1.3). The slow start of the year gradually improved as quarters went by, so that in the picture of the year there is an upward trend that peaked in the last quarter with a growth similar to that recorded at the end of 2024. As will be seen later, this same improving trend in the last part of the year was also observed in the tax base indicators.
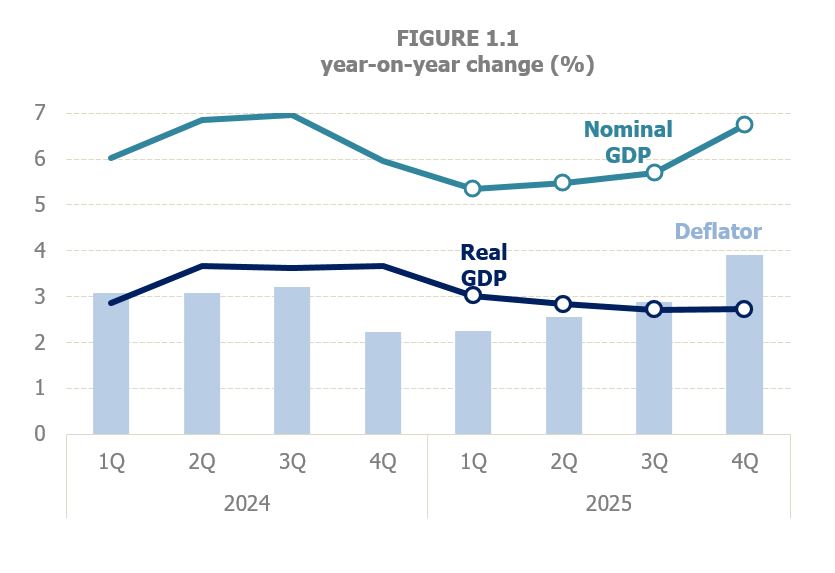
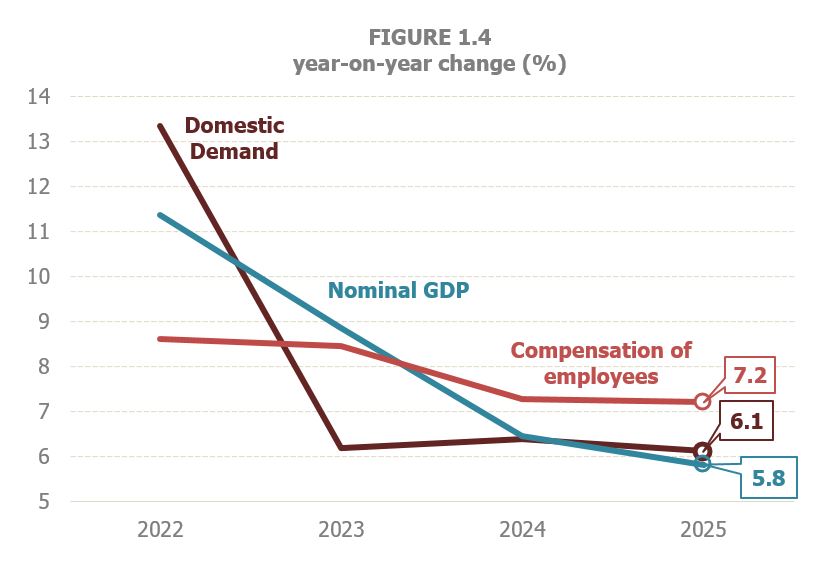
In nominal terms the slowdown over the year was similar to that seen in real activity. The result was a rise of nominal GDP by 5.8% in 2025 following 6.4% in 2024. The same cannot be said on the trend over the course of the year, upward in the case of nominal GDP (Figure 1.1), especially in the last quarter due to the rebound in prices in the final months of the year. The slowdown was also felt in domestic demand, a better pointer for revenues than nominal GDP. In 2025, domestic demand grew by 6.1%, three tenths less than in 2024 and one less than in 2023, which gives an idea of the intense and steady growth that this variable has shown since the recovery in 2022 following the impact of COVID-19 (Graph 1.4). Compensation of employees, another variable that explains revenues better than nominal GDP, barely noticed the slowdown, growing by 7.2% in 2025, almost the same as in 2024 (7.3%).
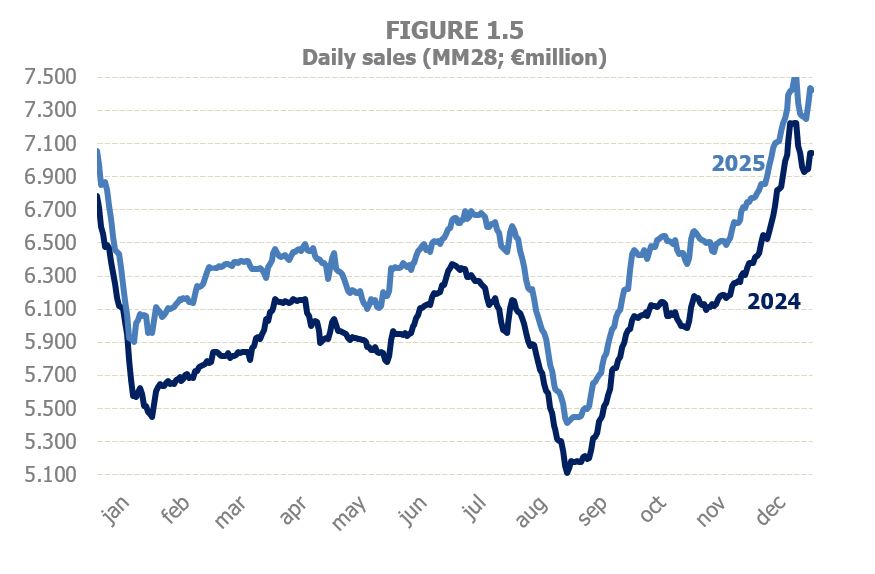
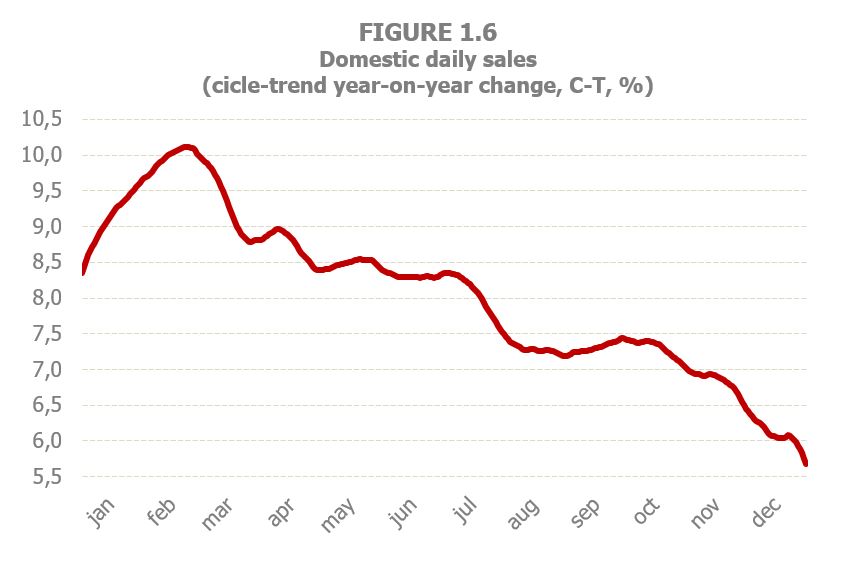
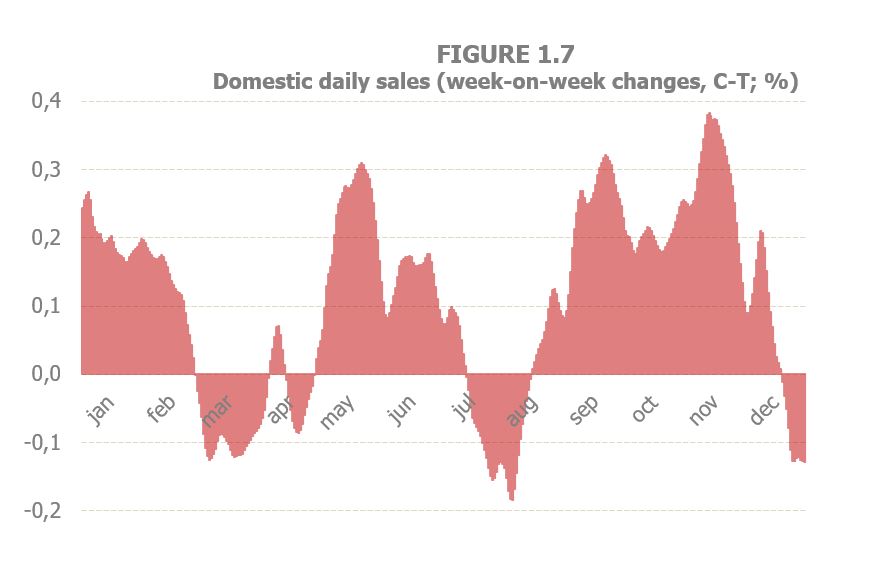
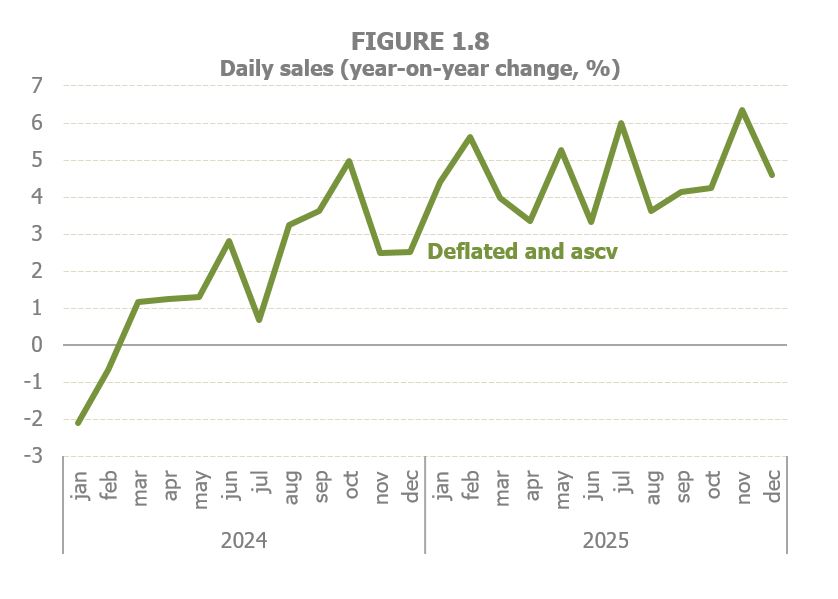
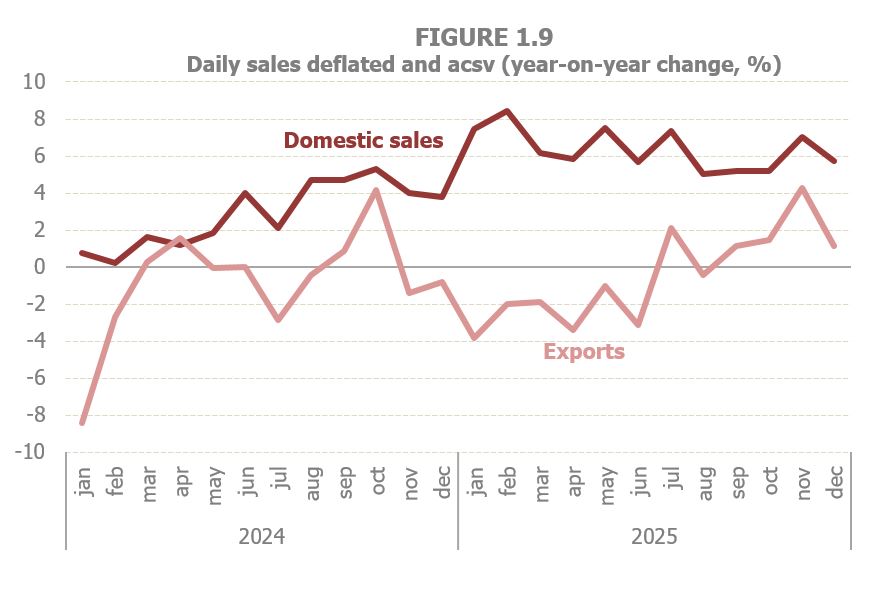
As to the main indicators derived from fiscal data, they also gave a sign of a slowdown throughout the year with a rebound in the last months, although overall growth in 2025 was higher than in 2024. Daily sales data from VAT Immediate Information System (IIS), grew at a faster pace than in 2024, starting from very high rates in the first half of the year and gradually easing (Figure 1.5). The information provided by these daily sales was completed in 2025 with the Daily Domestic Sales Flash, an indicator that delivers the daily domestic sales data a week earlier and also includes an estimate of the cyclical-trend component, to get a clearer picture of the underlying evolution of sales and allows to have indicators of the change in the very short term (day-to-day or week-to-week differences). Graph 1.6 shows the behaviour that followed this cycle-trend in 2025 with large increases at the beginning of the year that moderated later. Figure 1.7, with the week-on-week changes, shows at what points in the year activity picked up. However, the very clear deceleration profile of daily sales changes when the impact of prices is removed, especially industrial prices, whose variation, as will be seen later, was very different at the beginning and at the end of the year. For this reason, when analysing the daily data from a monthly perspective, once deflated and amended from seasonal and calendar variations (cvec), as done in Figure 1.8, the diagnosis is different: the trend is best characterised by a pattern of stability with the aforementioned upturn in the final stretch of the year. Moreover, the differing performance of domestic sales and exports is shown by Figure 1.9. For the former, there is a slight slowdown since the beginning of the year, consistent with what the Flash was showing, which breaks in recent months, while exports gradually recovered from the losses seen in the first half of the year to the growth of the last quarter.
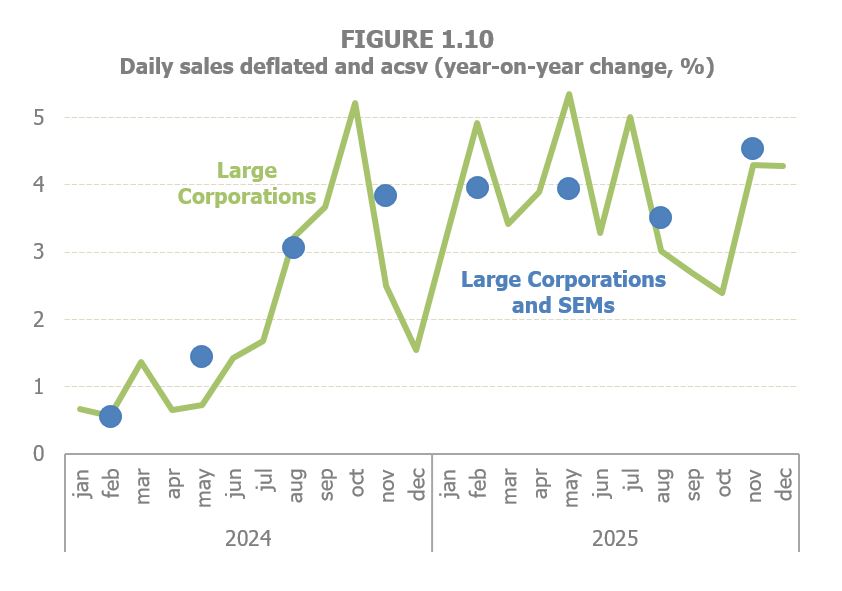
The same results were obtained in the Total Domestic Sales in Large Corporations and SMEs, the indicator that tracks the economic activity of over 1.1 million company on quarterly basis. Figure 1.10, in blue, shows an initial sales growth of around 4% that began to slow up until the last quarter, when an increase of 4.5% was recorded; in any case, all of the rates were significantly higher than those of 2024. The monthly indicator, which only shows the sales of the Large Corporations, albeit irregularly, also followed that same pattern.
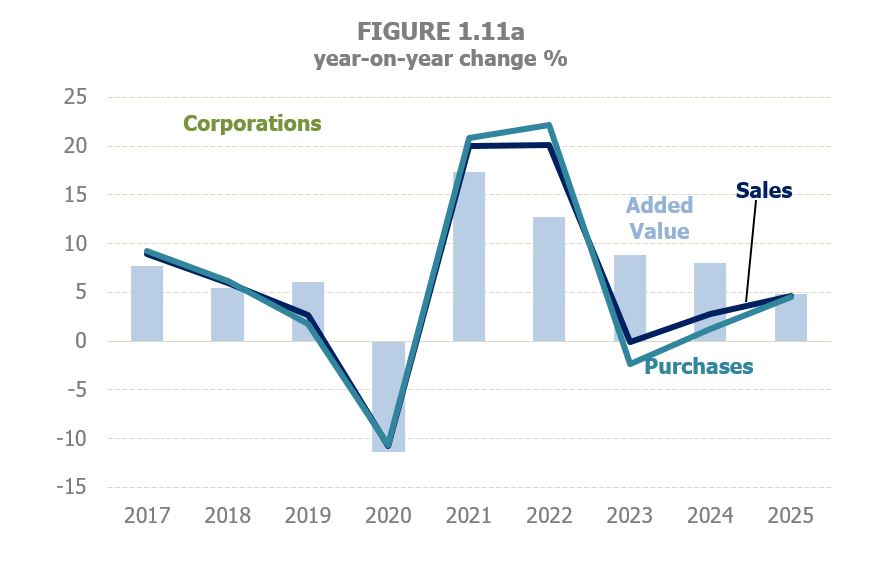
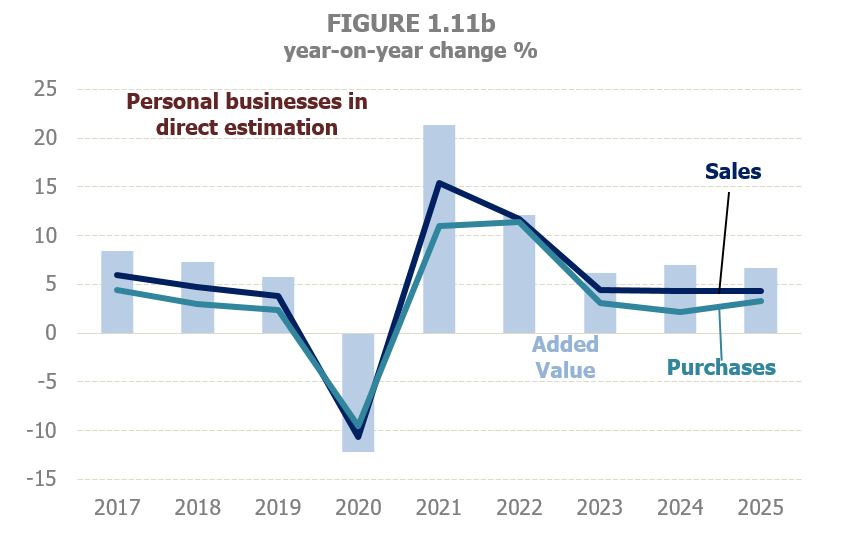
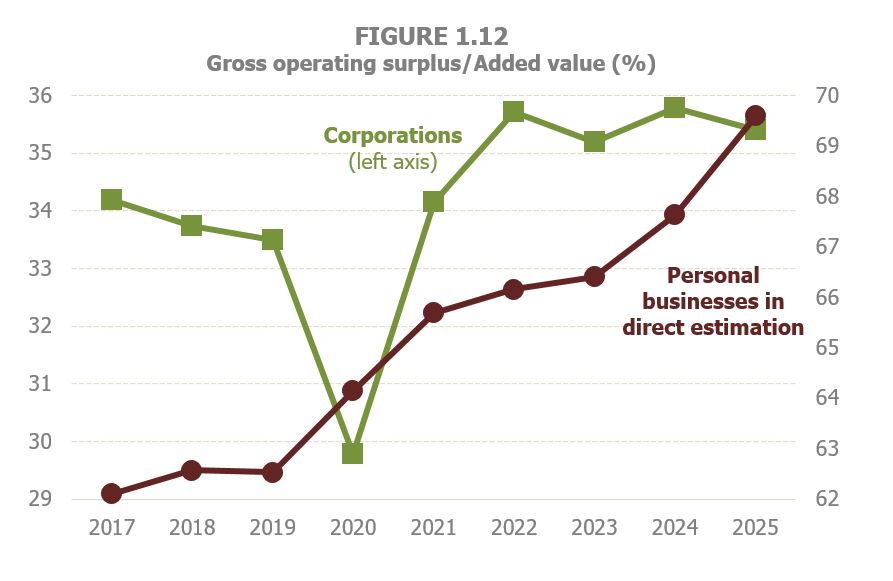
The analysis of the activity is rounded off with the results of the Business Margins Observatory, which adds more structural information, from the profit and loss accounts of the Corporate Income Tax and of personal businesses in direct estimation, to the short-term information from VAT returns and withholdings on earned income. This allows to track not only sales, purchases and salaries (which are already in the statistics of Large Corporations and SMEs), but also the remaining costs and the gross operating surplus that is the EBITDA estimate, one of the key indicators of business activity. Thus, Figures 1.11 (1.11a Corporations and 1.11b personal businesses) show the evolution of the creation of added value since 2017 (the Observatory also provides information on the quarterly estimate and the breakdown by sector). In 2025 added value growth moderated, more intensely in corporations than in personal businesses, despite the increase in sales analysed above. The breakdown of this added value between salaries and profits is shown in Figure 1.12, which displays the percentage of this added value that accrues to profits. In 2025 that share grew again in personal businesses, while it decreased slightly in corporations. However, in the latter, the percentage is in line with the figures recorded in recent years and well above pre-pandemic levels.
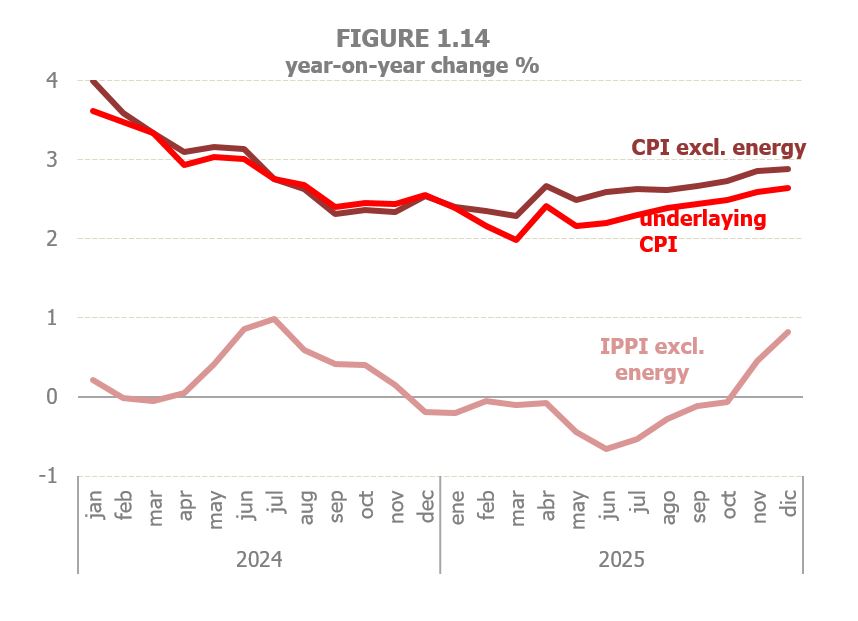
Regarding prices, the start of the year was a continuation of the inflationary upsurge that had marked the end of 2024 due to rising energy prices. After those first months, consumer goods and services inflation (CPI) moderated to return to the levels of the beginning of the year in the final stretch of 2025. In industrial producer prices (PPI), however, the rise continued to slow down until mid-year, with price drops in the last quarter, which explains why, as seen before, sales in nominal terms showed that patter of moderation throughout the year. Both developments can be seen in Figure 1.13. On an annual average, the CPI ended up increasing by 2.7%, one tenth less than in 2024, and the PPI grew by 0.9% compared to the decrease of the previous year.
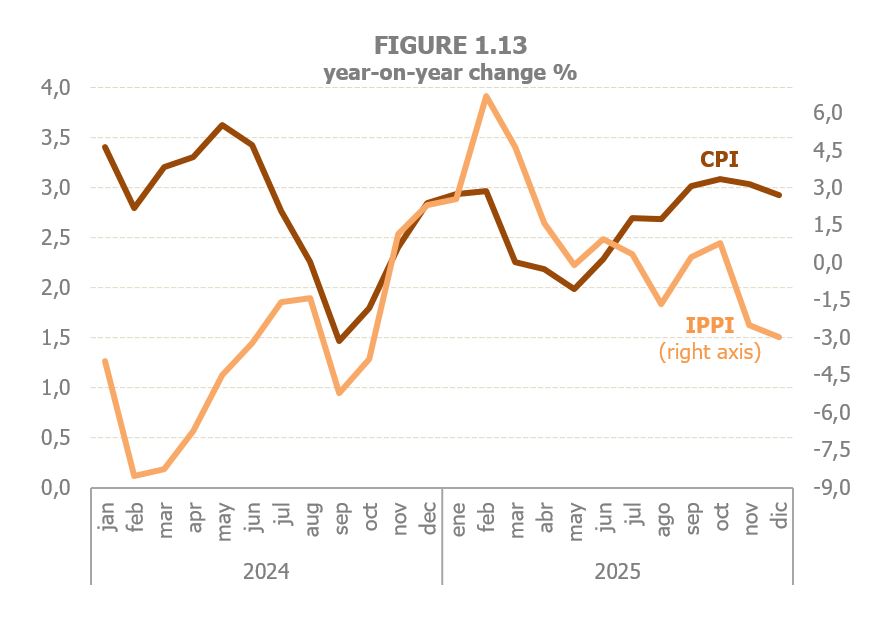
Figure 1.14 allows to the carry out the analysis isolating the impact of the energy component. In this case, on the one hand, it is seen the significant effect of this component on the evolution of the general indices, even when the most turbulent years in the energy sector had been left behind, and, on the other hand, the upward trend in prices throughout the year, even if, in the year as a whole, price growth rates were lower than those in 2024.
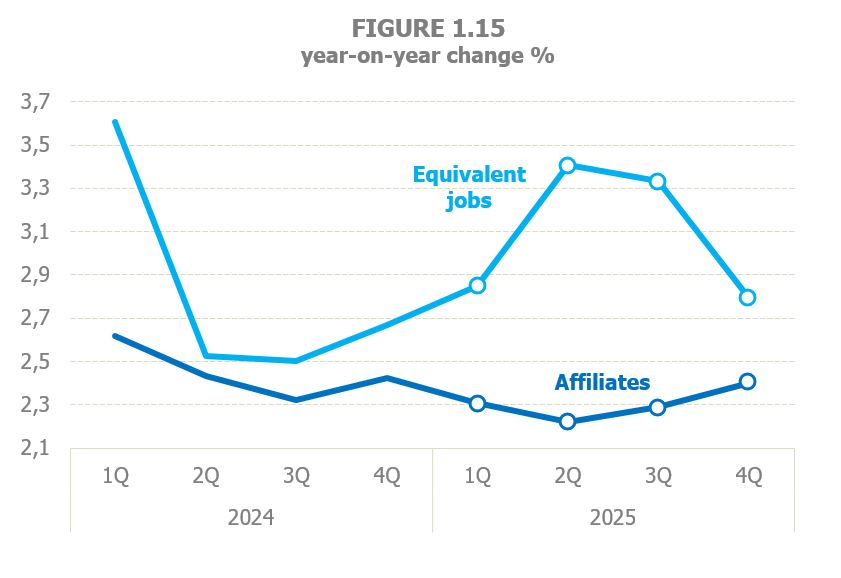
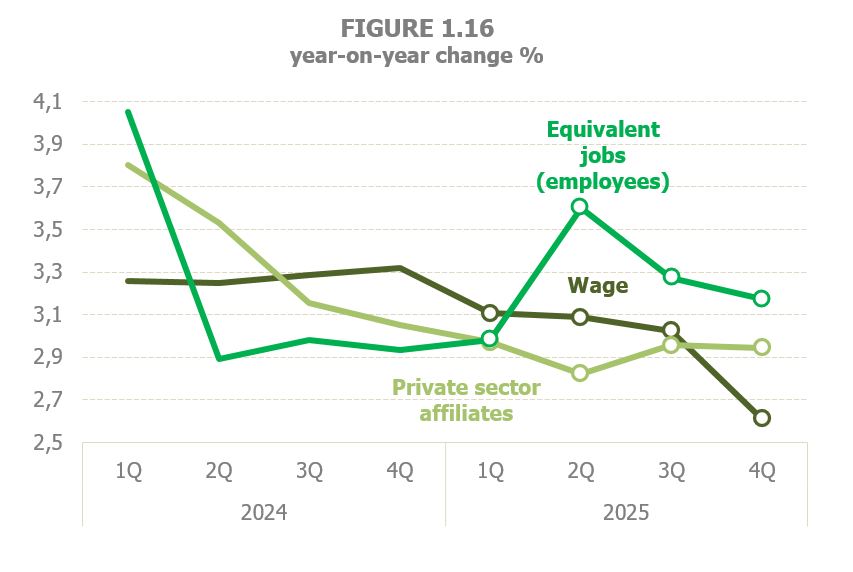
Finally, the labour market outlook in 2025 could be defined as one of stable growth compared with 2024. As is often the case, there are discrepancies between the various indicators, although more in the behaviour of employment within the year than in annual terms. Graph 1.15 illustrates how employments levels developed. On an annual average, growth was slightly lower than in 2024 when looking at Social Security affiliation (2.3% in 2025, 2.4% previously, Table 1.2), with an upward trend in the second half of the year, whereas it rose moderately (from 2.8% to 3.1%) when looking at the full-time equivalent employment of the National Accounts, which is a measure that summarises the evolution of employment, hours and average days. Throughout the year the trend in affiliation remained broadly in line with the trend of activity, especially in the final months. The data on salaried employment from the National Accounts (Figure 1.16) saw a slight increase (one-tenth for the year as a whole), while private sector salaried affiliates showed signs of moderation, rising from 3.4% in 2024 to 2.9% in 2025.