2. Personal Income Tax
In 2025 PIT revenue amounted to €142.47 billion, representing a 10.1% rise, rate two and a half points above the 7.6% reached in 2024. Had it not been adversely affected by management and regulatory measures, that detracted €1.15 billion from collection, the surge would stand at 11%, similar increase to that of the accrued tax, that stems from a tax base growth of 7.2% and an average tax rate growth of 3.5%. The fact that revenues in 2025 grew at a higher rate than in 2024, despite the fact that both, incomes and the average rate, grew at lower rates than a year earlier, is due to two factors: on the one hand, the outcome of the annual return of 2024, which recorded a remarkable increase (26%), entered in 2025; on the other hand, the negative effect of the aforementioned regulatory and management impacts was almost three times higher in 2024 than in 2025.
Gross household incomes grew by 7.2% in 2025, almost two points below the 8.9% in the previous year, but following four years of growth exceeding 7,9% (Table 2.1). Income from capital gains not subject to withholding remained strong in 2025, but the rest of income sources moderated their growth, with the slowdown being particularly pronounced in income from movable capital, following the strong increases achieved in previous years driven by the evolution of interest rates. Without these incomes, the slowdown in household incomes would be only six-tenths.
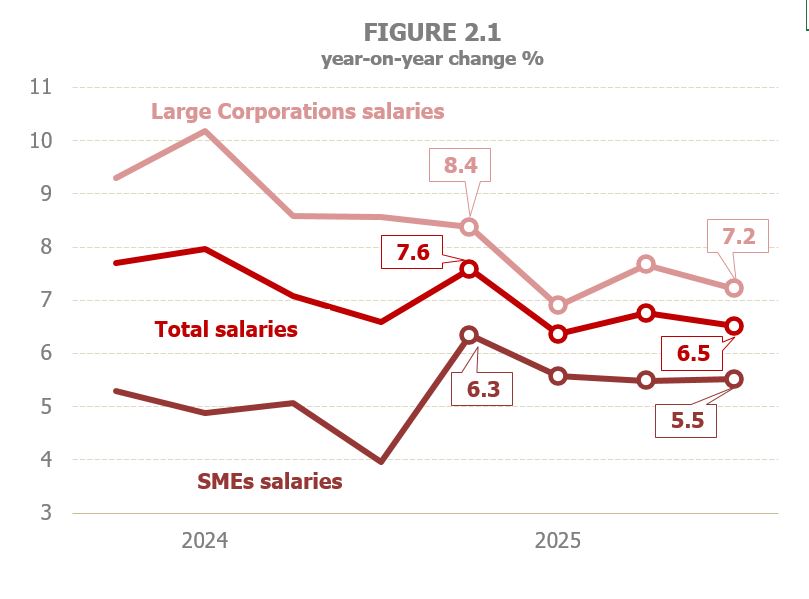
Earned income, representing over 82% of household income, grew by 6.2% in 2025, slowing down for the second year in a row (8.1% in 2023, 6.8% in 2024), in line with employment performance and average compensation. Even so, it must be noted that these incomes’ growth is more than one point above the average growth over the last ten years. Both, salaries and pensions, the two main elements that together account more than 93% of earned income, moderated their progresses in 2025. Salaries enlarged by 6.1% and public pensions by 5.9%, in both cases eight tenths less than in the previous year (Table 2.2). In the private sector, average wage increases went from nearly 5% in 2024 to less than 4% in 2025. In this sector, the slowdown in the salary bill was concentrated in Large Corporations, which lost 1.7 points compared to the previous year, despite closing the year with an average annual increase of 7.5%. The surge in the wage bill in SMEs was lower than in Large Corporations, 5.7%, but in this case following an improving trend, as they exceeded the rate observed in 2024 by almost one point. In sum, the private sector wage bill increased by 6.8% in 2025 (7.3% in 2024), with smaller increases in the final stretch of the year (Figure 2.1).
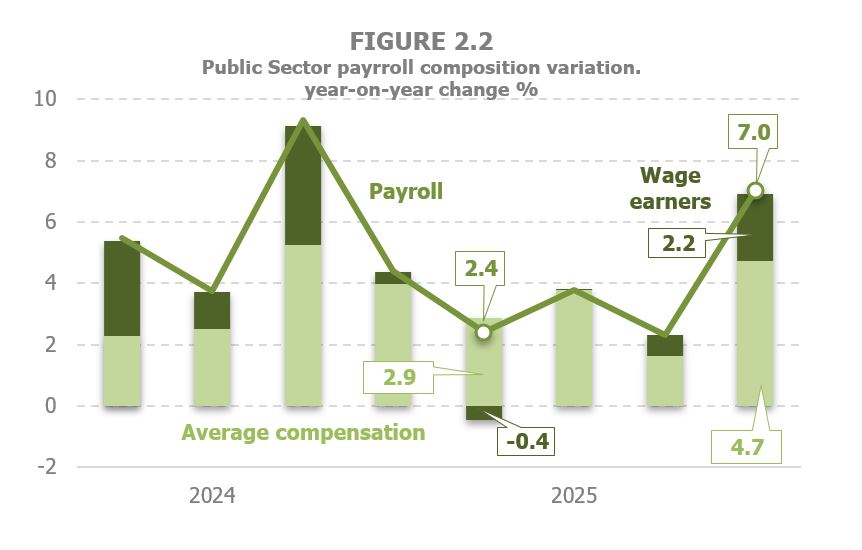
The slowdown of the salary bill in the public sector was deeper than in the private sector, moving from 5.6% in 2024 to 4% in 2025, due to the lower increase of employment (0.6% compared with 2.1% the previous year) while average compensation maintained a 3.4% growth thanks to the update of public salaries that took place in December (Figure 2.2).
The public pensions’ payroll expanded by 5.9%, with an increase of 1.7% in the number of beneficiaries, which shows a steady upward trend, and an increase of 4.2% in the average public pension, around one point below the rate reached in 2024 (Figure 2.3). Private pensions increased again, even more so this year, although their weight on the total payroll of pensions remains low (3.6% compared to 8% in the period 1995-2010, year after which they began to lose ground).
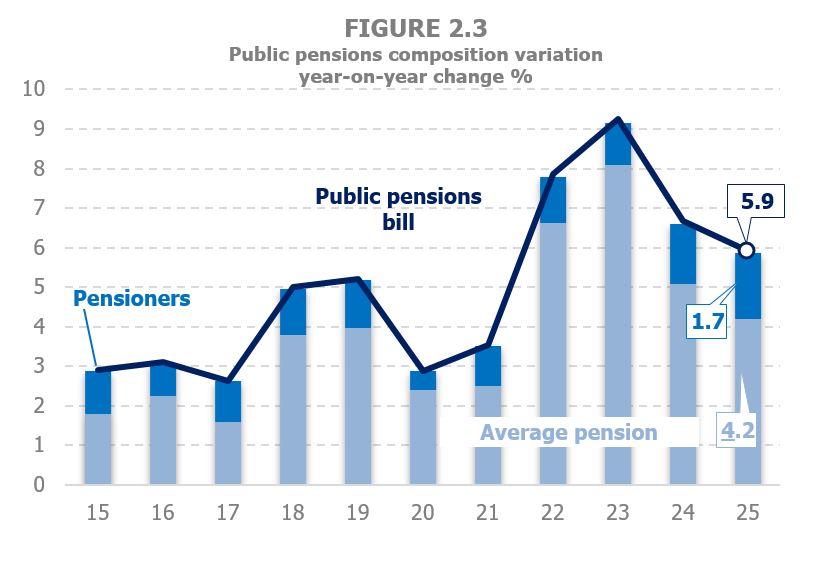
Figure 2.4 compares developments in average private and public wages, average pensions and consumer prices (CPIs) since 2010. In the case of wages, wage increases have not been sufficient to compensate for the increase in prices, while in the case of average public pensions, their evolution exceeds that of the price index.
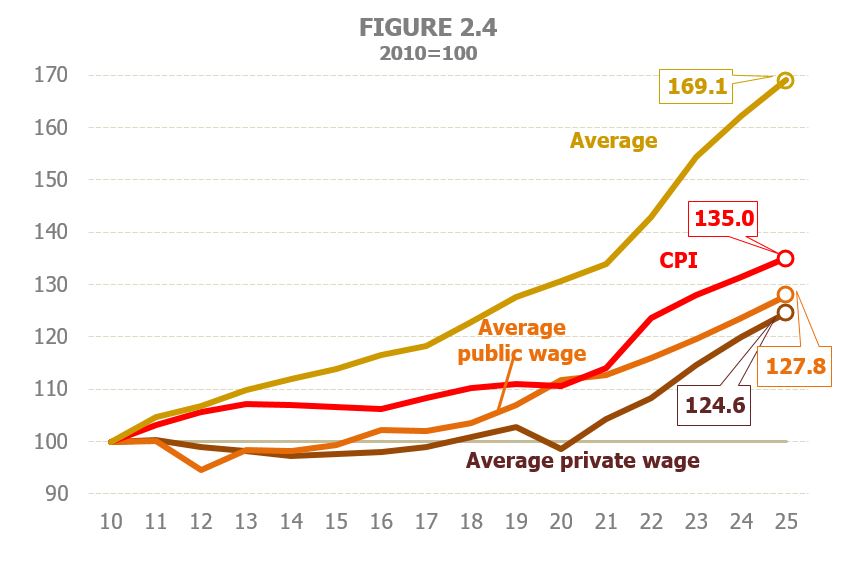
The rise in the average pension was driven not only by the annual update, but also the upward impact of the largest increases in the lowest pensions and the higher level of new pensions entering into the system compared to those already in it. It should also be noted that in recent years the increases in average wages in the private sector have been greater than in the public sector, so that the gap between the two has been closing since 2020.
Finally, in 2025 unemployment benefits increased for the third year in a row, and did so at a slightly higher rate than in 2024 (4.7% compared to 4.5% previously), the moderate acceleration being due to the higher increase in the number of unemployment beneficiaries (1.4% in 2025, 1% a year earlier), while the increase in the average benefit remained above 3%, although a few tenths below the rate recorded in 2024.
Total household capital income is estimated to have grown by 14.2% in 2025, a significant slowdown after rebounding to 27.2% in 2024. This development is a consequence of the sharp slowdown in income from movable capital (2.0% in 2025, 46% in Table 2.1). Capital income has regained a share of total household income not seen since 2008, as shown by Figure 2.5, although it has not reached the all-time high recorded in 2006, when it accounted for 13.8%. Behind this recovery lies the performance of capital income over the last five years, throughout which it has maintained an average annual growth of 14.2%. The breakdown of these incomes has changed over the years, as shown in Figure 2.6. Income from movable capital was the main component of households' capital income until 2015, when rental income began to play a predominant role, while capital gains were also becoming increasingly important.
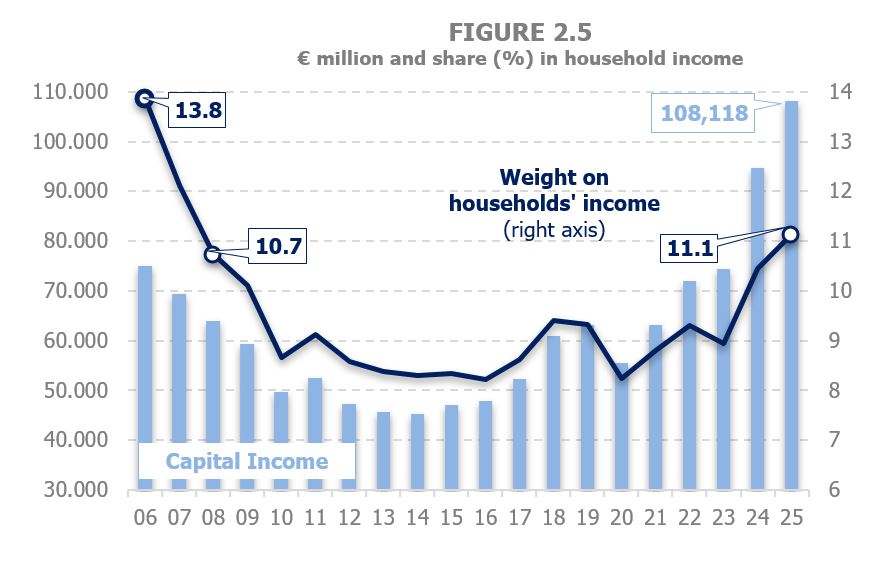
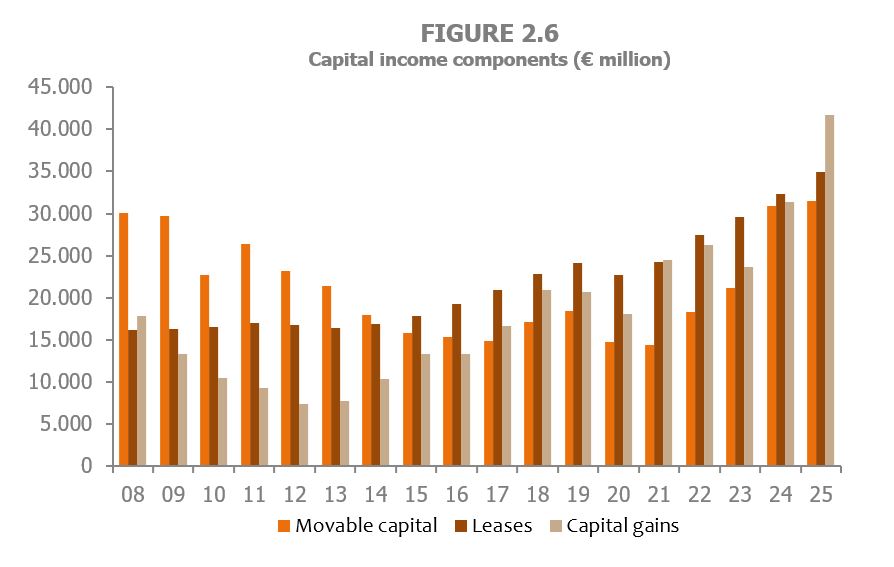
The strong momentum shown by income from movable capital since 2022, as well as the strong growth in capital gains last year, meant that by 2024 the three sources of capital accounted for a similar proportion of the total. By 2025, the once again expected significant rise in capital gains, will mean that this account for almost 40% of total capital income.
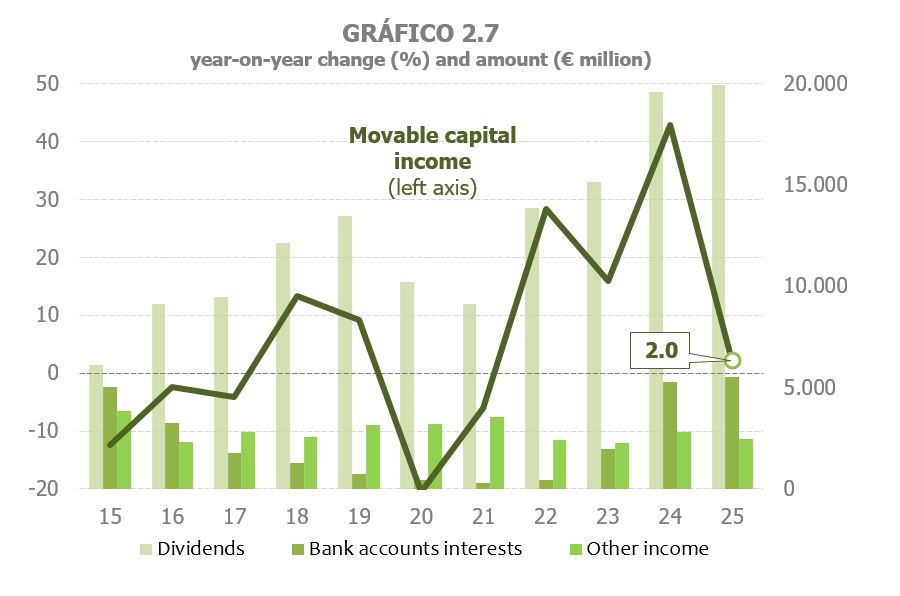
Movable capital revenues expanded by 2% in 2025, following strong gains in the previous three years, that recorded an average increase of close to 29% (Tables 2.1 and 2.4). From the end of 2022 interest income from bank accounts began to rise following the interest rate hikes that had been taking place for some time. That process continued to peak throughout 2024. Since then, a downward trend began, which, from the second quarter of 2025 onwards, resulted in losses compared to the income generated a year earlier. On the other hand, dividends, which have been the main component of movable capital income since 2015, also moderated their progress in 2025, following three years of intense increases (Figure 2.7), coupled with the decline in the rest movable capital revenues.
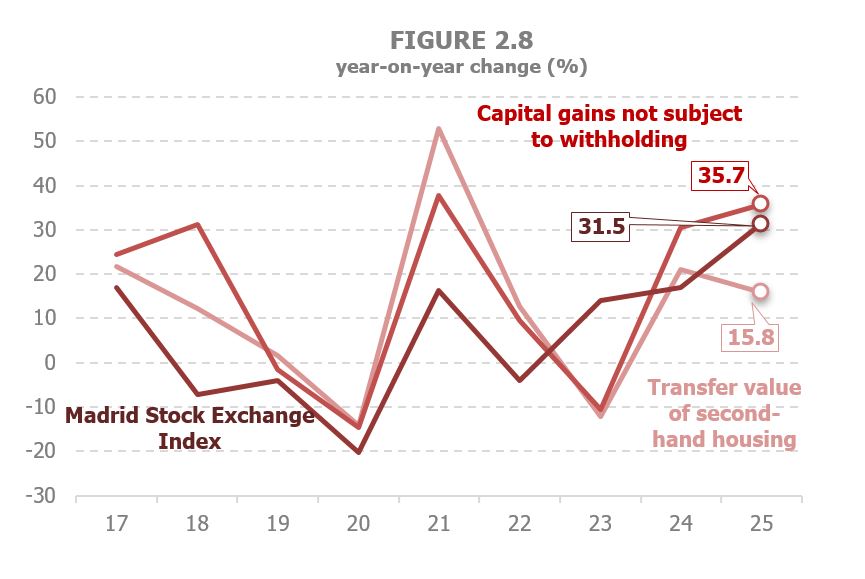
Capital gains are expected to continue growing strongly (32.6% in 2025 following the 32.8% growth in 2024) driven by the evolution of gains not subject to withholding, while mutual investment fund gains progressed by 4.1% in 2025, a figure far below the 58% reached the previous year (Table 2.1 and 2.6). The positive outlook for capital gains not subject to withholdings is linked to the strong performance of both share prices and real estate sales (Figure 2.8).
As for income resulting from the rental of real estate, the estimated increase is around 7.9%, a high rate but more moderate than in 2024 (9.2% Table 2.1 and 2.5). In this case too, a more favourable outcome is expected for income not subject to withholding (mainly rentals for housing) in contrast with income subject to withholding, mostly relating to rentals of real estate for commercial purposes, which, in 2025, expanded by 2.9%.
Finally, personal business income revenues are estimated to have grown by 8.6% in 2025. This rate is four points lower than the outstanding increase of 12.6% observed in 2024, but marks the fourth consecutive year of an average increase of 8.7%, a pace that exceeds by almost three points that achieve in other periods of expansion of these incomes (between 2013 and 2019 growth stood at around 5.8%, Table 2.8).
The effective tax rate on gross household income increased by 3.5% in 2025 (4.1% in 2024, Table 2.1 and Figure 2.9). Without the outcome of the annual return, the increase stands at 1.1%, compared to 1.4% in 2024. As in previous years, the rise in the rate is due to increases in wages and average pensions.
Accrued PIT grew by 10.9% in 2025, marking five consecutive years of growth. Between 2021 and 2025, the average rate of increase is 11.2%, resulting from an average increase in incomes of 7.5% and in the average effective rate of 3.5%. Excluding the outcome of the annual return, accrued PIT increased by 8.4% in 2025, as a result of the increase in the bases by 7.2% and the effective tax rate by 1.1% (Table 2.1).
PIT revenue increased by 10.1% (7.6% in 2024), eight tenths below the growth of the accrued tax. Most of the discrepancy is due to the fact that the latter includes the estimated accrued annual return outcome matching the 2025 fiscal year, while revenue in terms of cash include receipts and refunds corresponding to the annual return outcome of the year 2024. In addition, annual return refunds include the extraordinary refunds paid to the members of mutual funds. Revenue excluding the outcome of the annual return increased by 8.6%, a rate closer to that of accrued taxes excluding the annual return outcome (8.4%).
Withholdings on earned and economic activities income enlarged by 8.7% in 2025, virtually the same as in 2024 (9.0%). Earned and economic activities income increased by 6.0%, (6.7% the previous year), whereas the average tax rate remained at 2.5% (Table 2.3 and Figure 2.10).
In the private sector, withholdings on earned and economic activities income grew up to 8.9% (9.1% in 2024). The slowdown in the wage bill was partly offset by the larger increase of the tax rate. Growth differed in Large Corporations, where withholdings grew by 9.5%, and in SMEs, where they did so at 7.6%, but, while in the former the trend was slowing down with respect to 2024, in the latter the opposite arose, along with the evolution of their respective wage bills.
As for Public Administrations, withholdings on earned income grew by 8.1%, far-off the 9.7% of 2024. The lower growth in withholdings was mainly due to the lack of salary update for public employees, which took place only in December and therefore with little impact on 2025 withholdings (the greatest impact will be observed in the first months of 2026). Thus, salary income grew by just over 5%, some three points less than in 2024, as the impact of the late update of salaries adds to the slower improvement of employment and of the effective tax rate (that increased by 1.5% in 2025 compared with 2.6% in 2024). In contrast, revenues from withholdings on public pensions grew by about 11%, a figure close to 11.7% in 2024. The lower revaluation of pensions limited the growth of the pension bill, although part of that effect was offset by a greater increase in the tax rate (4.7% in 2025 compared with 3.7% in 2024).
Collection from movable capital withholdings grew by 7.1% in 2025 (Table 2.4). The growth is not minor, although it looks like if compared to the previous two years (26.7% in 2023, 40.8% in 2024), and even with 9.5% in 2022. The slowdown is less pronounced than that seen in income and in the accrued tax (that goes from 42% in 2024 to -1.5% in 2025) as December 2024 accrual, that was 35.2% higher than that of December 2023) was cashed in January 2025, with the December 2025 accrual (that dropped by 7.2%) being cashed in January 2026.
Withholdings on mutual investment funds’ gains increased by 12.2% in 2025 (Table 2.6). They also follow an exceptional rate in 2024 (69.6%). With this further growth, the level of these withholdings is approaching the maximum of 2021 (€988 million in 2025, €1,052 in that year). However, its evolution was very uneven in the year. In January, growth was quite strong, extending those of the last months of 2024, probably with an anticipation effect due to the entry into force in 2025 of the rises in the tax rate on savings for high incomes. During the following months, the increases were much more limited, rebounding sharply between June and October, to close the year with falls compared to 2024.
Withholdings from leases (mainly from commercial premises) grew by 5.2%, slightly below the previous year (5.8%, Table 2.5). The tone throughout the year was of stability around that average growth of the year.
In 2025 payments on account, related to the profits of personal businesses, grew by 11.4% (Table 2.8), thus, chaining three years of strong growth (in 2024 growth stayed 9.5% and in 2023, if corrected for regulatory changes, the increase would be of the same order). To illustrate this, it suffices to say that the incomes of these personal business were in 2025 almost 29% higher than in 2022 (in the same period wage and pension incomes increased by about 22%).
The outcome of the annual return, together with the withholdings on earned income, are the two elements that contribute the most to the growth of the PIT. In 2025 the positive outcome of the annual return increased by 26% (Table 2.9), slightly above 24% if it is taken into account that about €300 million were shifted from 2024 to 2025 due to the deferment, for the taxpayers of the province of Valencia, of the payment of the second instalment of the 2023 annual return. The cause of this strong growth was the positive behaviour in 2024 of the income not completely subject to withholding or payments on account (capital gains, income from movable and fixed capital and income from economic activities). Its impact on revenues was revealed at the time of filing the 2024 return, at the end of June 2025. Refund requests also felt the increase of these incomes and only grew by 1.7%, compared to increases of around 15% in the two previous campaigns. This circumstance is not observed in the refunds paid, which grow by 16%, as, it must be recalled, these include extraordinary refunds to mutual fund holders.