4. Valued Add Tax
VAT revenues grew by 9.9% in 2025, amounting to €99.53 billion (Table 4.2), almost four points more than the tax base, consumption subject, that increased by 6.1% (Table 4.1). The discrepancy between the two figures is explained by the rise in the average rate resulting from the complete return to standard rates of food staples, in addition to the differential effect on electricity, gas, wood and pellets, when compared to 2024, when the recovery of the 21% rate was in force for only a few months in the case of electricity (between March and June, due the fall in prices) and since April for gas, wood and pellets.
In the case of energy products, the recovery of the standard rate, resulted in additional revenue compared with 2024 amounting to €562 million. In food, the differential impact was huger, €2 billion, as the comparison is with a year when the convergence to original rates started in October, so that in cash terms the increase in revenues that prompted was only recorded in December.
In 2025, final spending subject to VAT closed the year with a growth of 6.1%, a slight improvement compared to the rate of 5.7% estimated for 2024 (Table 4.1), improvement concentrated in its volume component since the deflator component only increased by one tenth (Figure 4.1).
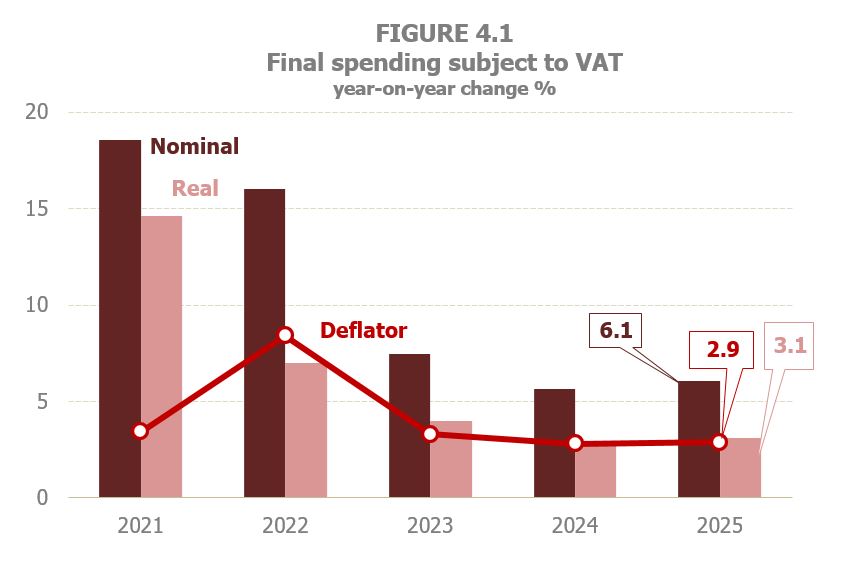
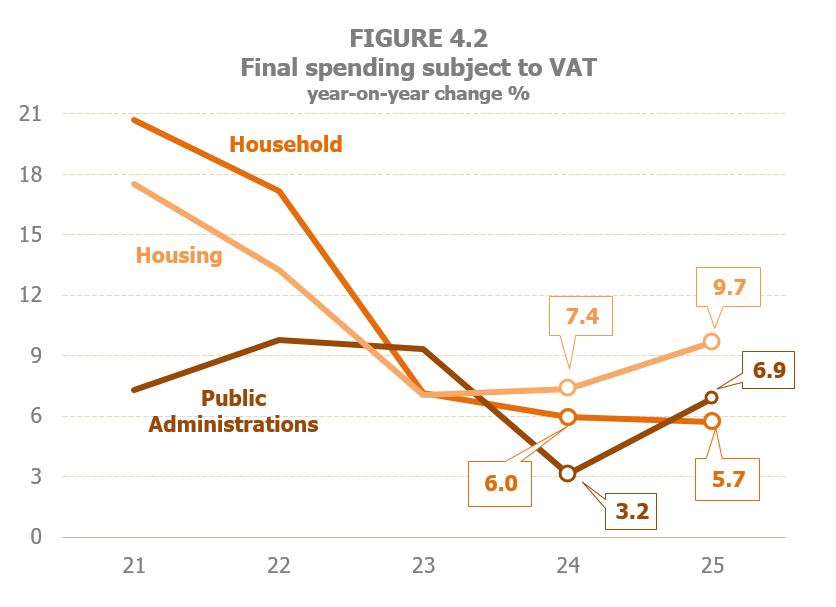
When focusing on the agents of spending, household expenditure, the main component of final spending subject to VAT, was the only one that showed a slight slowdown in its growth rate (5.7% in 2025 compared with 6% in 2024), due to price moderation and with a steady 3% rise of its real component. On the contrary, current and capital expenditure of Public Administrations intensified further (6.9% in 2025, 3.2% previously) motivated by the surge of the real component. Also household expenditure on new housing peaked up (9.7% in 2025, 7.4% formerly), with the entire increase being driven by the rising prices (Figure 4.2 and Table 4.1).
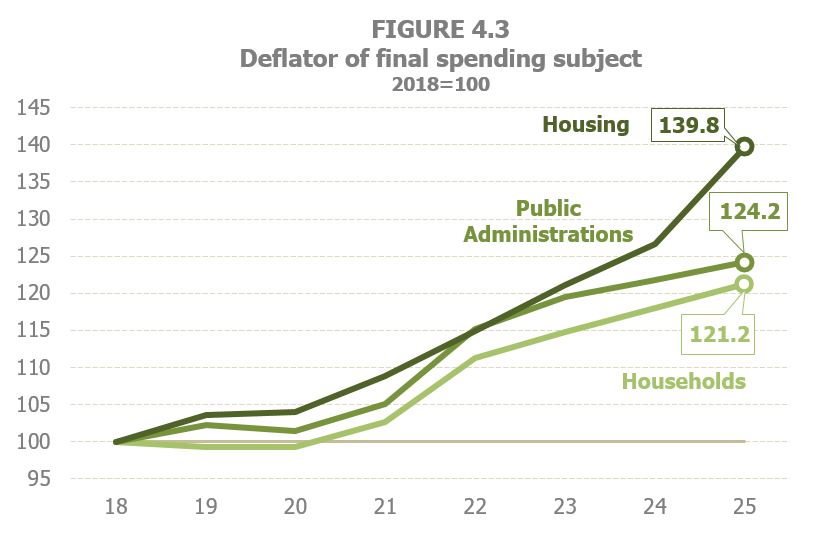
The incidence of prices on the different expenditure components has changed since the start of the inflationary cycle started in 2021. Figure 4.3 illustrates this fact. Using 2018 as the baseline, it can be seen that up to 2020 the trends of expenditure deflators showed similar patterns, given the moderation and stability of prices at that stage. In 2022, year of the sharp rebound in prices, the increase was greater in those that affect household and Public Administrations spending. However, since 2023 it has been housing prices that have shown the greatest acceleration, so that in 2025 the deflator relating to housing expenditure would be almost 40% higher than the figure recorded in 2018, while the deflators of household consumption expenditure and Public consumption would have grown by around 21% and 24% respectively in the same period.
VAT effective tax rate increase is estimated at 3.7% in 2025 (Figure 4.5 and Table 4.1) as a result of the recovery of the tax rates previous to the successive rate cuts adopted since 2021 to mitigate the effects of rising energy prices (electricity, natural gas, wood and pellets) and then, in 2023, of food staples.
Table 8.7 shows the breakdown by tax rate of spending subject to the tax. The breakdown returns in 2025 to a situation similar to that observed in the period between 2013 and 2019, prior to the Covid crisis and the repeated cuts that followed from 2020 to tackle the inflationary process.
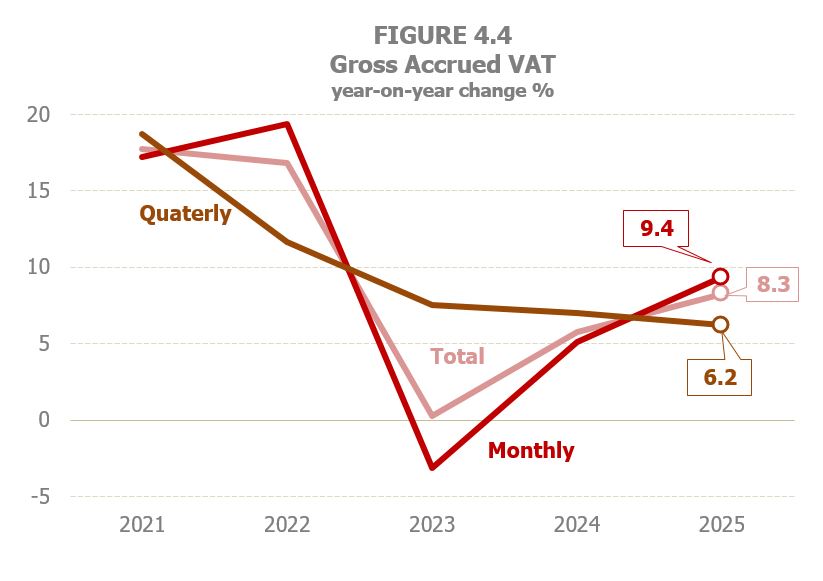
Accrued VAT increased by 10%, almost four points more than the spending subject to the tax (Table 4.1), due to the increase in the average rate resulting from the recovery of the rates on electricity and food staples. An alike rate is expected for net accrued VAT (which differs from the previous one because it includes the change in the balance that companies carry forward from one period to the next). Gross accrued VAT (Table 4.2) closed the year at a 8.3% rate. The impact of the rate hikes, to bring them back to the levels prior to the rate cuts, varied depending on the type of taxpayer, depending on their position in the value creation and distribution chain for the products affected by the changes. Thus, monthly self-assessments recorded greater increases (mainly Large Corporations and Groups), which touched 9.4% from 5.1% in 2024, as they were more impacted by rate hikes, while in quarterly self-assessments the increase stood at 6.2%, more than three points below the monthly self-assessments and also below the 7% in 2024.
With regard to refund requests, they grew by 3.7% for the year as a whole, with an increase of 2.9% in monthly requests and 6.3% in annual ones.
Tax receipts in terms of cash increased by 9.9%, with an increase in gross revenue of 8.6% and a rise of refunds paid of 5.2% (Table 4.2). Collection from self-assessments improved by 8.1%, due to the larger increase of total gross VAT, to the strong progress in revenue related to deferrals and audit activities (16.3%), that gathers a share of the largest deferrals requested in 2024 and 2025. By type of taxpayer, although there is still a greater increase in monthly self-assessments (8.3%) than in quarterly ones (7.5%), the gap between their rates is less than one point, below the difference seen in accruals. The reason is that the accrual matching the last quarter of 2024 is cashed in 2025, and it showed a better performance than the one linked to the last quarter of 2025, to be cashed in the first month of 2026. This shift between accruals and cash also explains why the slowdown of accruals in quarterly self-assessments is no reflected in cash receipts.
VAT refunds paid grew by 5.2% in 2025. Monthly refunds paid increased by 5.5% mostly due to two reasons: the larger refunds requested both in 2024 and in 2025, and the improvement in the pace of payment of refunds in 2025. As for annual refunds, they increased once again (2.4%), despite requests for fiscal year 2024 (submitted at the end of January 2025) had decreased by 1.8%. The reason for this discrepancy lies in the increase in extraordinary refunds. Finally, there was also an increase in refunds related to foral adjustments and imports (9.3%).