Information note 5. The minimum interprofessional wage and the distribution of wage income recipients
The Annual Tax Collection Report is accompanied by a series of files in which detailed information can be found on some aspects relating to the evolution of the tax bases and taxes. One of them is the one that refers to the Salary Distributionboth nationally and by Autonomous Communities. These files provide the distribution of people, withholdings and rates by salary brackets of 200 euros in width since 2001:
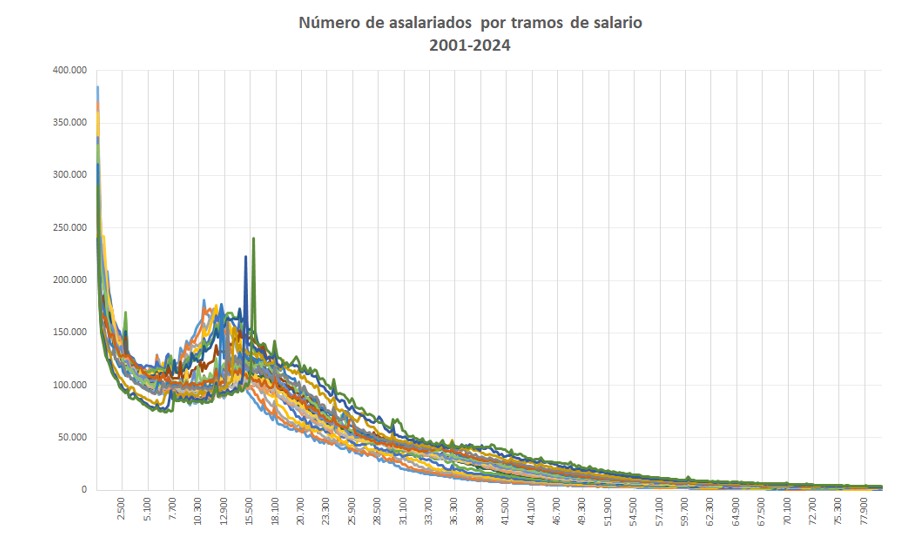
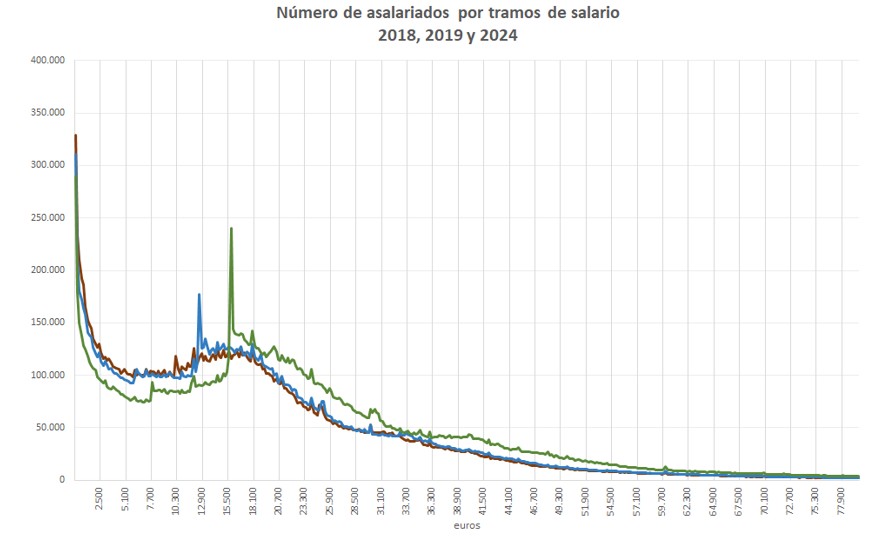
At first glance, some peaks can be observed that have become characteristic in recent years and are associated with the recent evolution of the Minimum Interprofessional Wage (SMI). The comparison in the following graph between the years 2018 (brown), 2019 (blue) and 2024 (green) gives an idea of those changes.
This note examines in an exploratory way to what extent that growth of SMI has influenced the evolution of the curve of recipients of wage income: whether it has simply resulted in the appearance of those very visible peaks in the distribution or whether it has also influenced the evolution of salary brackets close to SMI.
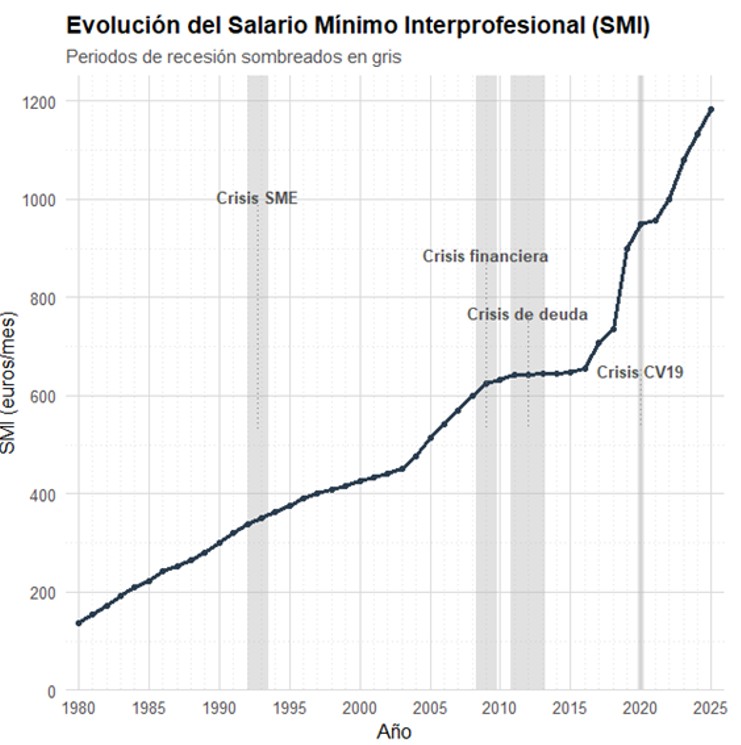
As can be seen in the following graph, the SMIIt experienced a drastic level change in 2019:
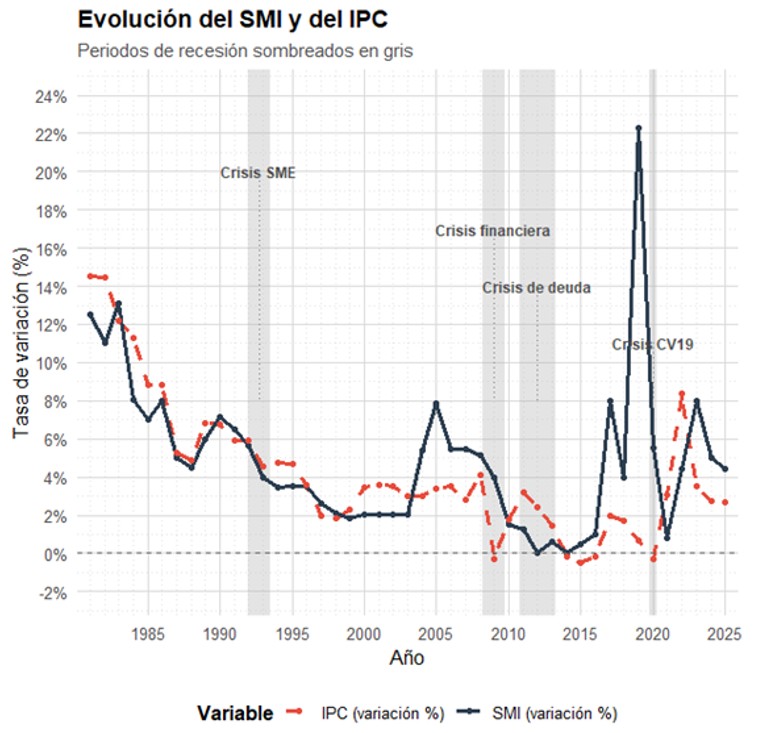
The variation of SMI It is conditioned, among other factors, by the evolution of the inflation rate, in line with a policy of preserving the purchasing power of the wage income associated with it. Until 2018 the correlation between both variables was high (0.84), even despite the existence of years (2000-2004, 2011-2013) in which the increases of SMI they unmoored from CPI. The following graph illustrates this relationship:
The increase recorded in 2019 (21.6%) and the resulting change in level led, as has been seen, to the appearance of a differential peak around the SMI. The direct comparison of the curves observed in 2018 and 2024 with the average curve 2001-2024 clearly shows the concentration around the SMI in 2024: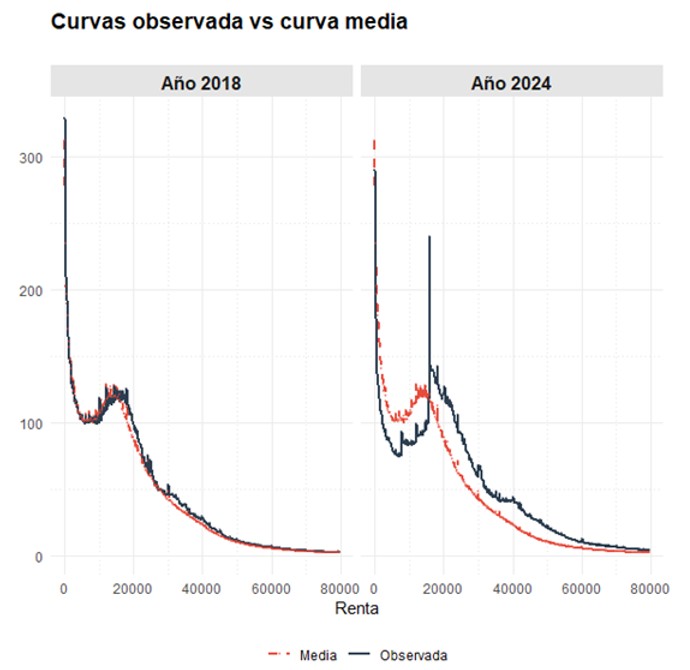
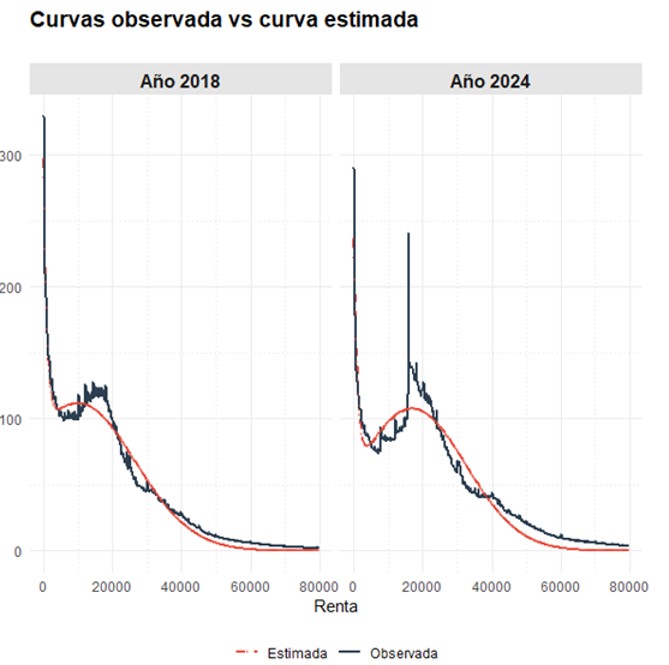
This differential impact is also apparent when each year is examined separately, comparing the distribution observed in 2018 and 2024 with the corresponding statistical estimates of a parametric model that smooths its irregular elements (Quilis, EM and Frutos, R. (2020) “A dynamic analysis of the wage distribution in Spain”, Institute of Fiscal Studies, Working Papers no. 3/2020):
The discrepancies in the group associated with SMI The discrepancies between the observed and estimated curves can be attributed to the recent evolution of SMI, as highlighted by its positive linear relationship:
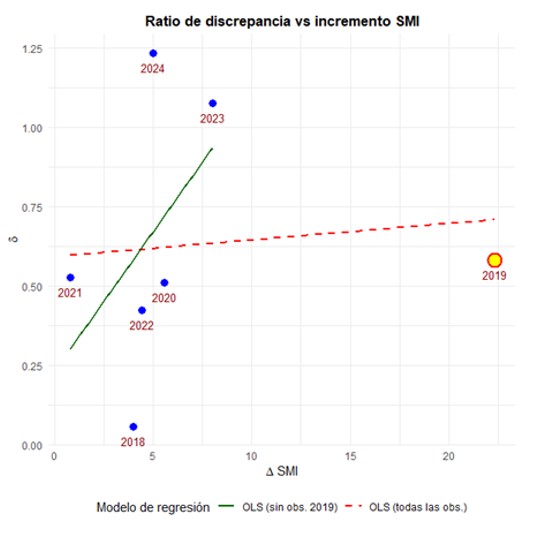
With due caution due to the small sample size, a positive relationship between changes in the SMI and the size of the discrepancy between the observed and estimated curve, especially if the influential nature of the 2019 data is discounted. This relationship extends, albeit with less intensity, to the groups adjacent to the SMI: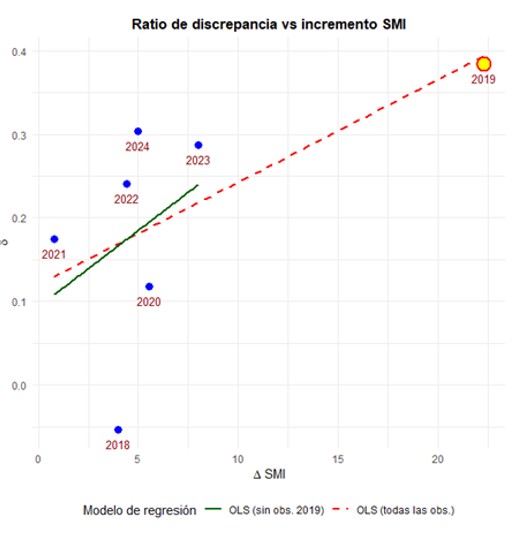
This positive relationship, on which the 2019 data is no longer influential, is compatible with the hypothesis that there has been a positive spillover effect from the increase in SMI not only on the income group with which it is directly associated, but also on the closest brackets, thus expanding the scope of the measure.