Information note 9. The evolution of final expenditure subject to VAT and the effective rate
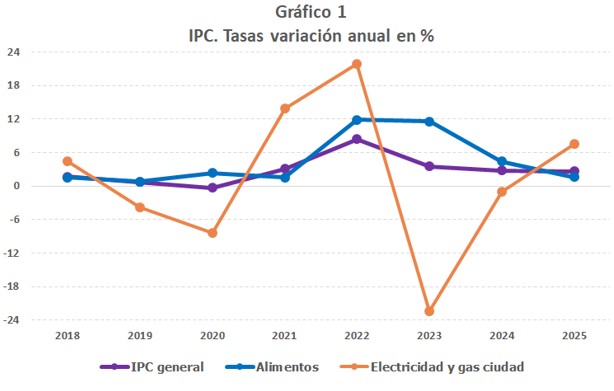
In recent years there have been several regulatory changes that have affected the effective rate of VAT. These changes originated in the inflationary crisis that began in late 2021. Initially, it was particularly intense in energy products, but later it also affected other products, so that, when the prices of the former began to moderate, even registering drops, other products, such as food, continued to show very high rates. Chart 1 illustrates these points.
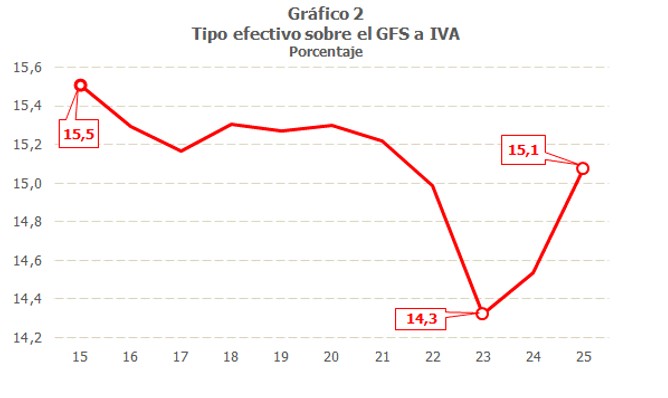
To address these price increases, measures were adopted, among others, to lower the interest rate. VAT associated with electricity consumption in contracts with contracted power less than 10 kW (from 21% to 10% from mid-2021 to June 2022 and a further reduction from 10% to 5% from July of that year), the reduction of the rate of VAT from 21% to 5% applicable to natural gas, wood and pellets (from the end of 2022) and the reduction of the rate of VAT on basic food (since January 2023). These measures were gradually reversed from January 2024, so that 2025 was the first full year with rates similar to those in force in 2020. The evolution of the average effective rate on Final Expenditure Subject to VAT (GFS), as is logical, has been affected by these regulatory changes, as can be seen in Graph 2, where it can also be observed how the estimated level of the rate for the year 2025 is slightly lower than the average of the period prior to the reductions, that between 2015 and 2020, which was around 15.3%.
To understand this evolution, it is important to consider that the behavior of the average rate is conditioned by the composition of the subject expenditure, which can be modified not only by the impact of regulatory measures, but also by changes in prices and consumption levels of the goods and services subject to the tax. Chart 3 summarizes the evolution of the weights of the main spending groups since 2015, comparing the GFS which has been affected by regulatory changes with the estimate that would have been observed in the absence of said changes (it should be noted that, in addition to the measures mentioned above, in 2021 an increase in the rate of VAT which affected sugary drinks, which went from being taxed at 10% to 21%). Also included is the average weight associated with the period 2015 to 2019, prior to regulatory changes and excluding the year 2020, affected by the Covid crisis.
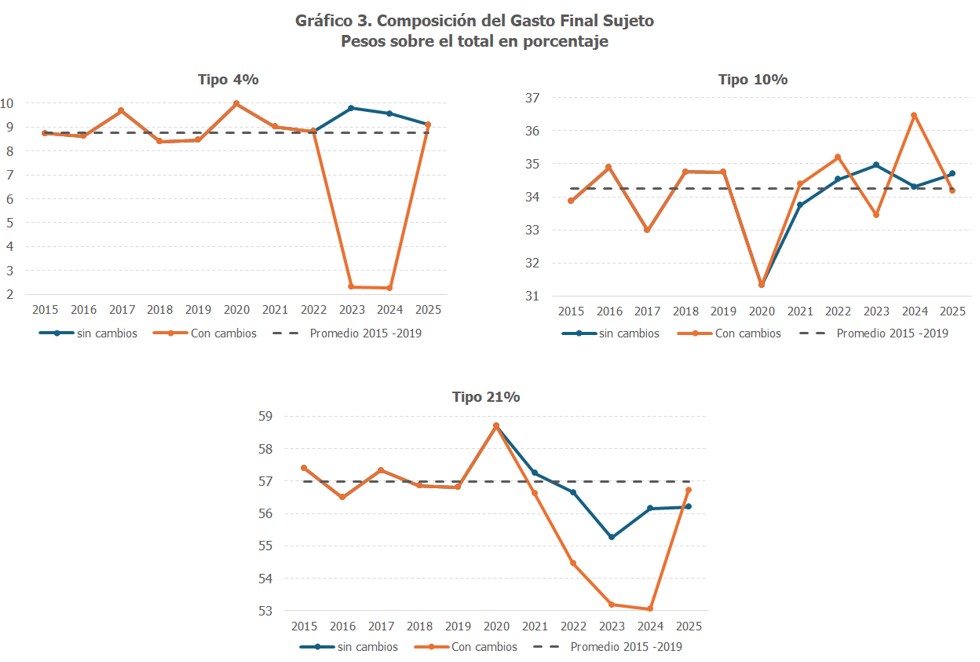
It is observed that in 2025 the components of expenditure subject to taxation at 4% have gained weight on the total final expenditure, at the expense of the expenditure component taxed at 21%, while the expenditure component taxed at 10% maintains a level similar to the average of the period between 2015 and 2019. This change in the composition of spending pushes down the average rate in 2025, a year that is no longer affected by relevant regulatory changes compared to the 2015-2019 period (except for the one mentioned that affects sugary drinks).
Similar results are obtained if external information is used, such as that provided by the Household Budget Survey, published by the INE , which provides the amounts of household spending (including the VAT) with a broad disaggregation of goods and services. From these amounts, the expenditure for each of the goods and services can be obtained, excluding the VAT, which would be similar to the taxable base of the tax for households. While it is true that this perspective does not encompass everything GFS, as it does not include the expenses associated with the AA.PP. Nor can household spending on home purchases help to understand the evolution of GFS total, since the household spending component is the largest component of the total (representing around 82% of total spending in the period between 2015 and 2025).
Chart 4 shows the rates of change in household spending, excluding the VAT, broken down by the tax rate applied to each good or service, leaving the expenditure on food and energy products in 2024 in the group corresponding to the rates recovered in 2025, in order to have a clearer view of the behavior of the three main components since 2019.
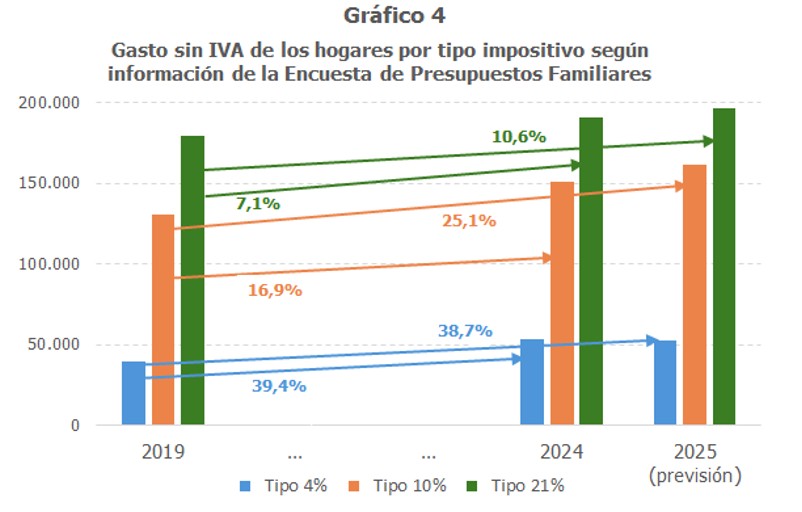
It is clear how spending on goods and services taxed at 4% has grown between 2019 and 2024 by over 39%, a rate similar to that estimated for the increase from 2019 to 2025. This increase is greater than that observed for the group of goods and services taxed at 10%. And both are well above the increase associated with goods and services taxed at 21%.