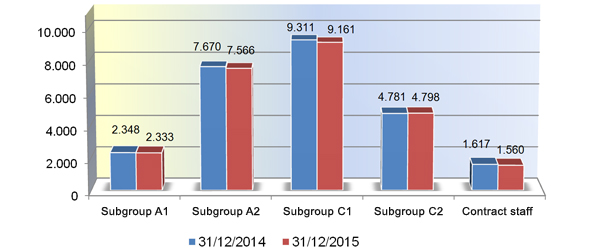
*The number of employees of Subgroup E is not shown: 15 in 2014 and 11 in 2015.
Generate PDF
Generating the PDF may take several minutes depending on the amount of information.
Select the information you wish to include in the PDF:
You can cancel the PDF generation at any time.