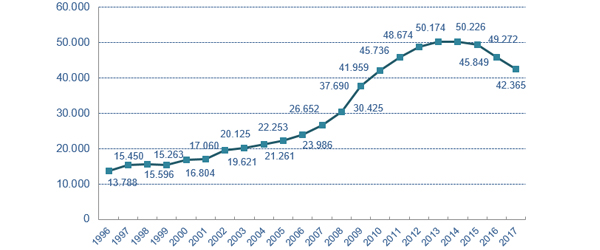
Table 25. Evolution of outstanding debt
|
|
1998 |
19989 |
2000 |
2001 |
2002 |
2003 |
2004 |
2005 |
2006 |
2007 |
|---|---|---|---|---|---|---|---|---|---|---|
|
Amount outstanding at 31 December(*) |
15,596 |
15,263 |
16,804 |
17,060 |
19,621 |
20,125 |
21,261 |
22,253 |
23,986 |
26,652 |
|
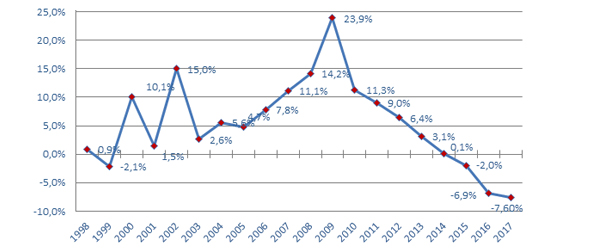
Rate of variation |
-2.1% |
10.1% |
1.5% |
15.0% |
2.6% |
5.6% |
4.7% |
7.8% |
11.1% |
|
2008 |
2009 |
2010 |
2011 |
2012 |
2013 |
2014 |
2015 |
2016 |
2017 | |
|---|---|---|---|---|---|---|---|---|---|---|
|
Amount outstanding at 31 December(*) |
30,425 |
37,690 |
41,959 |
45,736 |
48,674 |
50,174 |
50,226 |
49,272 |
45,849 |
42,365 |
|
Rate of variation |
14.2% |
23.9% |
11.3% |
9.0% |
6.4% |
3.1% |
0.1% |
-2.0% |
-6.9% |
-7.6% |
(*) Amounts in millions of euros.