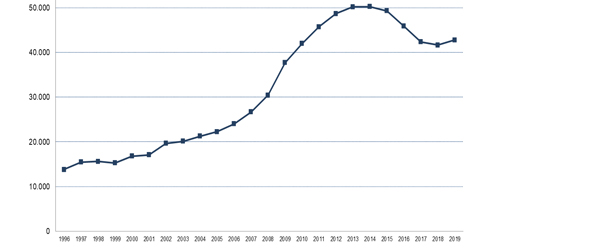
Table 37. Evolution of outstanding debt
|
|
2000 |
2001 |
2002 |
2003 |
2004 |
2005 |
2006 |
2007 |
2008 |
2009 |
|---|---|---|---|---|---|---|---|---|---|---|
|
Amount outstanding at 31 December (*) |
16,804 |
17,060 |
19,621 |
20,125 |
21,261 |
22,253 |
23,986 |
26,652 |
30,425 |
37,690 |
|
Rate of variation |
10.1% |
1.5% |
15.0% |
2.6% |
5.6% |
4.7% |
7.8% |
11.1% |
14.2% |
23.9% |
|
2010 |
2011 |
2012 |
2013 |
2014 |
2015 |
2016 |
2017 |
2018 |
2019 | |
|---|---|---|---|---|---|---|---|---|---|---|
|
Amount outstanding at 31 December (*) |
41,959 |
45,736 |
48,674 |
50,174 |
50,226 |
49,272 |
45,849 |
42,365 |
41,628 |
42,770(**) |
|
Rate of variation |
11.3% |
9.0% |
6.4% |
3.1% |
0.1% |
-2.0% |
-6.9% |
-7.6% |
- 1.7% |
2.7% |
(*) Amounts in millions of euros.
(**) In 2019, there was an extraordinary charge of 1.3 billion euros in compensation for acts of terrorism (Back)
Evolution of outstanding debt as of December 31 of the years included in the period 1996 - 2019