Chart No. 19. Evolution of visits (visited pages) to the Tax Agency's web portals
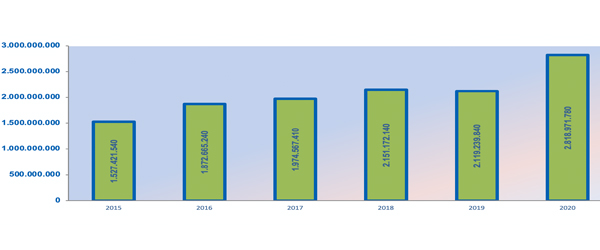
 Number of pages visited in the web portals of the Tax Agency
 Number of pages visited in the web portals of the Tax Agency, including intermediate pages of the Agency applications