Chart No. 27. Evolution of the number of deferment requests
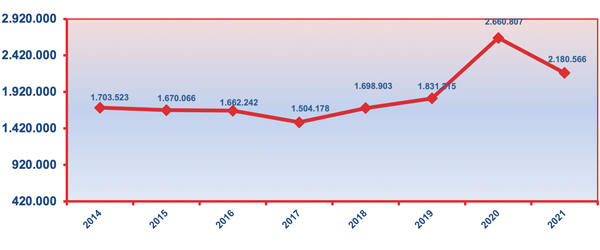
(*) The increase experienced in 2020 is affected by COVID measures that facilitate requests for deferrals without cost
(*) The increase experienced in 2020 is affected by COVID measures that facilitate requests for deferrals without cost