Chart 30. Evolution of amount of deferment requests
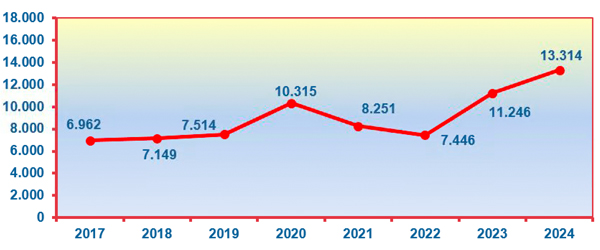
Amounts in millions of euros.
(*) E The increase experienced in 2020 is affected by the COVID measures that facilitate requests for deferrals at no cost
(**) The increase experienced in 2023 is motivated by the changes approved to make the granting of deferrals more flexible.