Municipal income statistics with tax sources
In recent weeks, two statistics have been published that exploit tax information on personal income from a municipal perspective.
These are the Statistics of personal income tax filers by municipalities and the Statistics of personal income tax filers by municipalities of the largest municipalities by postal code , both corresponding to the 2022 financial year. Both publications are a detailed version of the Personal Income Tax Return Statistics , which only has the breakdown by autonomous community. These statistics also provide information on other exempt income that is not included in the annual income tax return, as well as the calculation of the total number of adult taxpayers (one in individual and joint single-parent returns, two in joint returns for married couples).
The information contained in both statistics facilitates analysis from multiple perspectives: Income composition according to the size of the municipality, evolution of income before and after taxes, dispersion of income and tax rates within each territory (total, autonomous and municipal). But, without a doubt, what is most striking is always the position occupied by the different municipalities in the ranking, even though this position is quite stable over time for most of them. The availability of these statistics since 2013 allows us to see this stability both above and below. Figures 1 and 2 below illustrate this point.


The graphs show the position occupied by the first six and last six municipalities in 2022 over time. As can be seen, in both cases at least four of those six municipalities have remained in the best/worst positions in the last ten years.
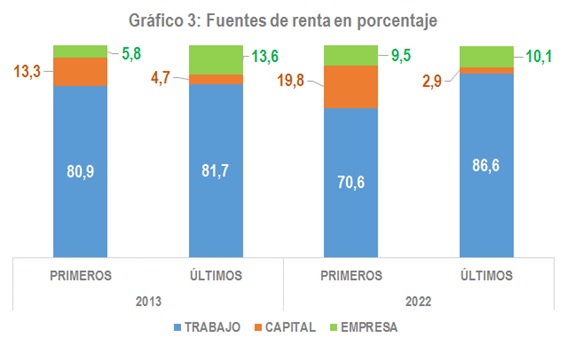
An interesting result obtained when analysing the data from the perspective of temporal evolution is the change that has occurred between 2013 and 2022 in the weight that the different sources of income had in the municipalities that occupied the first six places and those that were at the bottom of the classification in one year and the other. Chart 3 shows this evolution.

It highlights how capital and business income have been gaining ground in municipalities with higher incomes, compared to the greater stability of the most disadvantaged municipalities, where, on the contrary, the contribution of work income has increased, which, for these purposes, also includes pensions and other exempt benefits.
Despite the wealth of municipal information, in larger municipalities this dimension is too broad, hence the need and interest in having greater disaggregation, which is achieved in this case through postal codes. With this greater disaggregation, it is possible to see, for example, where the postal codes with an average gross income of more than 50,000 euros are located (most of them concentrated in some areas of the provinces of Madrid and Barcelona), or the dispersion of income within each municipality can be calculated as the difference between the highest and lowest gross income in the postal codes of each locality. The latter is what is done in Graph 4, which shows that, logically, the greatest dispersion usually occurs in large municipalities, although that is not the whole explanation (Fuenlabrada, which appears with the least dispersion in the graph, has a larger population than Alcobendas).
