New developments in the 2022 Wealth Tax statistics
In early September, the Statistics on Wealth Tax Declarants for the year 2022 was published.
The Tax Agency website contains all the years since 2003, with the exception of the years 2008-2010, during which the tax was suspended (through a 100% state bonus). In addition, the information can be completed with the samples that are also offered on the website ( Tax Agency: Tax data samples ).
In this new edition, two new features and a result that has attracted attention in some media are worth highlighting. The first of the new features are the tables relating to the distribution by deciles of the declarants (the distribution by deciles consists of ordering from lowest to highest and subsequently dividing the entire population into 10 groups with the same number of members). The traditional presentation of data by item already included a distribution with fixed tax base sections. Now information by deciles is added to the usual tables. The two distributions are very different and it cannot always be said that one is better than the other. It depends on what you are trying to measure. Fixed rates can generate some interpretation problems, especially in cases where the variable being measured is in nominal terms and is therefore subject to inflationary processes. In this sense, the decile distribution offers some advantages, especially in intertemporal comparison.
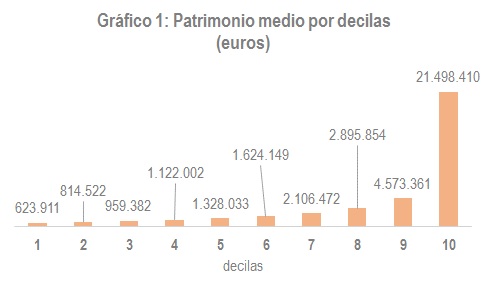
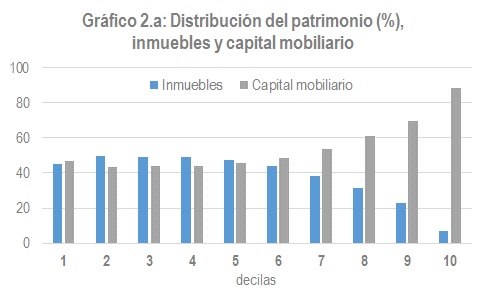
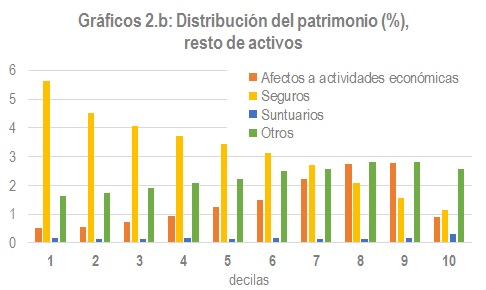
In any case, this new form of presentation enables us to see the enormous differences between the various groups, both in terms of the level of assets and their composition. Chart 1 shows the disparity in average assets, while Charts 2.a and 2.b show the very different composition of their assets.
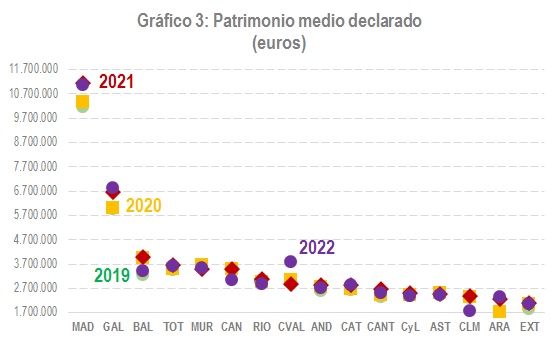
The second new development concerns regulatory changes to the tax and related figures. In general, the tax has been very stable in recent years. Without major regulatory changes, the tax base shows little variability. This can be seen in Chart 3, which shows the average assets declared in each of the Autonomous Communities. since 2019.
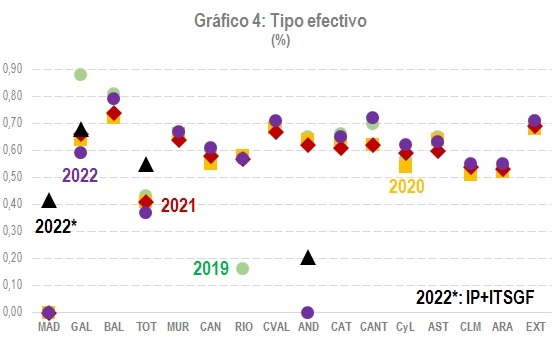
In 2022, however, two significant changes occurred. On the one hand, some changes came into force, such as a 100% bonus on the tax to be paid in Andalusia (as the Community of Madrid already had) and a 25% bonus on the full tax in Galicia. On the other hand, it was the year of the implementation of the Temporary Solidarity Tax on Large Fortunes (ITSGF), which is a complementary wealth tax aimed at balancing the tax burden by territories. Given its complementary nature, basic information on this new tax can also be found in the Wealth Tax statistics (complete information is not available due to statistical secrecy issues). The impact of both events can be seen in Chart 4, which shows the effective rates since 2019 and, in the case of 2022, also the effective rate including the ITSGF.

Chart 5 is a different way of analyzing the impact of the ITSGF in 2022 by bringing together the information for that year from the two previous charts:
Also linked to these developments is the result that has attracted attention in some media. This is the drop in declarants in the 2022 fiscal year. Chart 6 shows the evolution of the number of declarants since 2015:
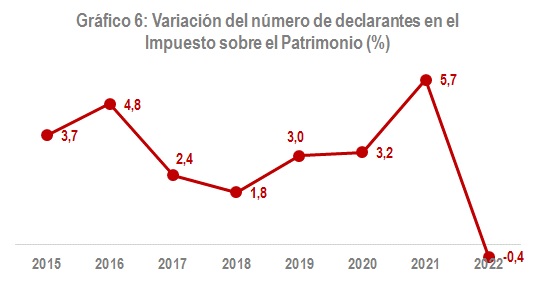
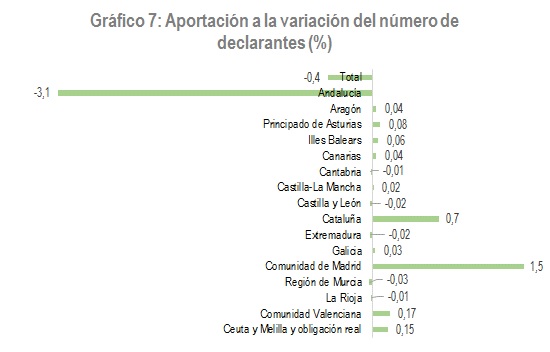
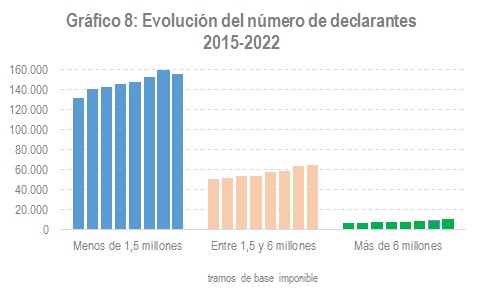
Indeed, in 2022 the number of taxpayers decreased by 0.4%, a decrease that contrasts with the continuous growth that had been observed since 2015 and even since 2011, the year in which the tax was recovered and reformulated. However, it is easy to see, when analysing the evolution by Autonomous Community, that the fall is exclusively due to the reduction in the number in Andalusia, a community in which, in 2022, with the 100% bonus, only those taxpayers with assets exceeding 2 million euros were required to file. The following two graphs show this clearly: Chart 7 shows the contribution of each community to the total variation and Chart 8 shows how the decline is concentrated in the lower sections.
