The new housing statistics
As noted in this same newsletter a few months agoIn recent years, the amount of information provided by the Tax Agency on rentals and, in general, on housing has increased significantly. The first works on this subject were linked to the development of the rental price index and of the State system of reference indices for housing rental prices, both from the Ministry of Housing and Urban Agenda, projects in which the Tax Agency participates together with the Cadastre. Since then, this same information has been used in different contexts. Along these same lines, and coinciding with the publication of the 2023 edition of the Statistics of the declarants of the PIT , the new one was unveiled Statistics on housing declared in the PIT , which seeks to offer, based on tax information, a snapshot of the residential real estate market belonging to individual owners.
Since 2021, when the Statistics of the declarants of the PIT For 2019, this included a housing module that exploited the detailed data on income from real estate activities included in section C of the declaration dedicated to real estate. The new statistics incorporate this module, which was already being published, and also expand the information with data such as rental prices and the profitability of real estate activity.
To compile these new statistics, it is essential to have the information provided by the General Directorate of Cadastre. The combination of information from the declaration of the PIT and the one available in the Cadastre is possible thanks to the cadastral reference. This reference allows to cross the properties declared in the PIT with the cadastral database. The declaration reveals the different uses that the owners give to their properties (primary residence, rental for primary residence or for other purposes, and available housing), as well as the declared income and the time computed for each of the uses. The characteristics of the properties are obtained from the cadastral information (whether or not they have premises qualified for housing, square meters, cadastral value, reference value). This same crossing is the one used, as has been said, in the State system of reference indices for housing rental prices of the Ministry of Housing and Urban Agenda.
The statistics consist of two clearly differentiated blocks of information. In the first block, the statistical unit is the property used as housing. In the first part of the block, the dwellings are classified according to their use (habitual residence, rented or available), distinguishing between those rented that are used as habitual residence and those that have other uses (tourist or seasonal rental).
The second part of the first block is dedicated to rented housing, whether as a primary residence or not. Information is provided on monthly rental prices, rent per square meter, average square footage of homes, average reference values, and average gross rental yield. Information is available at the level of Autonomous Community, Province, Municipalities with more than 20,000 inhabitants, and, for larger urban centers with more than 20,000 rented homes, also by postal code. The tables are completed with maps for the average rental price of a primary residence and for the average profitability of renting a primary residence.
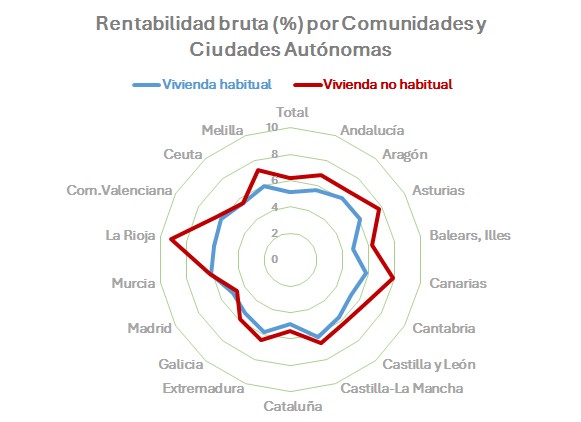
When comparing the rental prices presented in this section with other available information, several factors must be taken into account. Firstly, the published prices are averages, which is a difference with the data published by the State system of reference indices for housing rental prices in which the median for each geographic area is published. On the other hand, the Ministry of Housing and Urban Agenda's reference system refers only to rentals for primary residences, while the statistical coverage is broader as it also includes homes rented for other uses. This is one of the greatest contributions of the new statistics, given that such information has not existed until now. These new data allow for a comparison of the profitability of different types of leasing in different areas of the country.
When comparing these statistics with other sources, it should be noted that the territorial scope of the statistics is the Common Tax Regime Territory (i.e., it does not include taxpayers domiciled in the chartered territories) and that the properties considered constitute the entire stock of rented housing each year, not just new contracts. This latter feature guarantees information of an incomparably large size compared to other sources, and also eliminates the biases that these other sources incur by not having comprehensive information on properties or actual rent paid.
The second block is the same one that has been published since 2019. In this block the perspective changes. The unit of analysis becomes the equivalent dwelling, which is defined as the product of the percentage of ownership and the number of days the property has been owned. All economic concepts, both rental income and expenses and the imputed rent of available housing, are affected by this housing-use ratio. In this block, homes are classified by the taxpayer's address and by the location of the property. This section presents an income statement for the leasing activity that allows for the analysis of the details of the income and expenses recorded in the leasing declaration. PIT by the owners of the properties.