Consumption and revenue from alcohol taxes
One fact that has been highlighted in both monthly and annual revenue reports in recent times is the decrease in alcohol tax consumption and its consequent impact on the revenue derived from it. A summary of the evolution of the consumption of different types of alcohol can be found in Table 9.3 of Annual Tax Revenue Report and an analysis of the revenue of each of the figures in Tables 5.2, 5.3 and 5.4. The analysis can be deepened by referring to Special Tax ReportPublished at the same time as the Annual Tax Collection Report, it provides detailed information on these taxes (and also on the Fluorinated Greenhouse Gases Tax and environmental taxes). For each of them, you can find a file with the most relevant information about the tax (collection, tax accrued, consumption, rates, prices, international comparison…), in the form of a database and with pre-designed query boxes.
The following graph shows the evolution of alcohol consumption in its main varieties, taking 2015 as a reference. It can be seen how, after the drop caused by the pandemic, consumption recovered, but then, with greater or lesser continuity depending on the case, consumption began to decrease. In 2025, consumption was still higher than in 2015, although, as is the case with higher-proof drinks (those taxed under the Special Tax on Alcohol and Derivative Drinks), consumption was already close to the level of that time. The revenue (Alcohol and Derivative Beverages, Beer and Intermediate Products) follows a similar path.
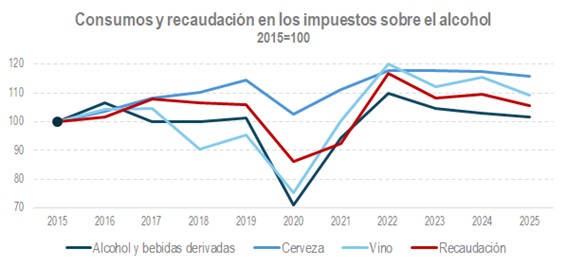
The immediate effect of this recent evolution of consumption and revenue collection is the loss of importance of these taxes in the overall tax revenue managed by the Tax Agency. This decline is clearly seen in the following graph, which shows the weight that these taxes have had in total tax revenue since 1995.
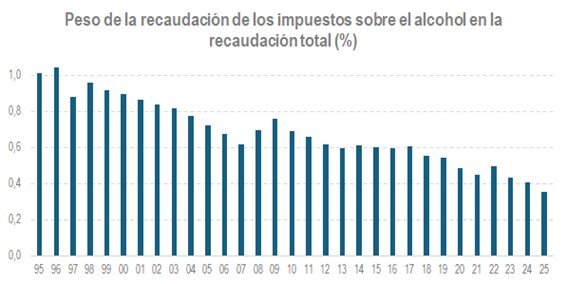
In 2025 that percentage reaches a minimum of less than 0.4%. However, these taxes never had a significant impact (at their peak, just over 1%) and the downward trend predates the decline in consumption in recent years. There are two basic reasons that explain the low weight and downward trend: the low rates that these taxes have always had and their lack of updating over time.
The classification of tax rates as low can be made by comparing the rates in force in Spain with those applied in other countries in our environment. As is known, excise taxes are subject to European Union regulations that require minimum rates. The following graphs show how Spain's taxes on alcohol are always close to that minimum, if not right at it, a considerable distance, in most cases, from the rates that are common in other countries. All the information in the charts originates from the European Commission and can be consulted at the aforementioned address. Special Tax Report.
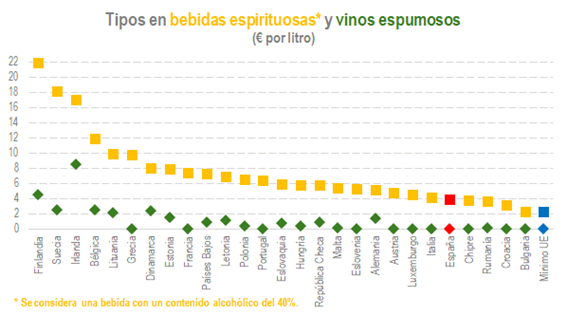
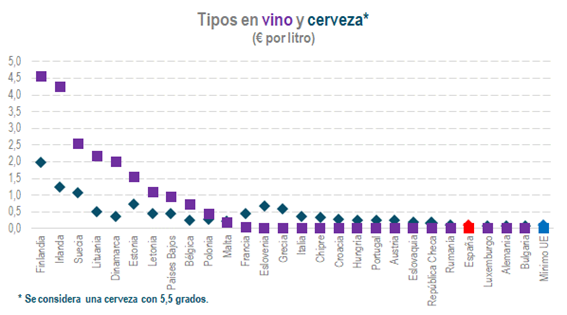
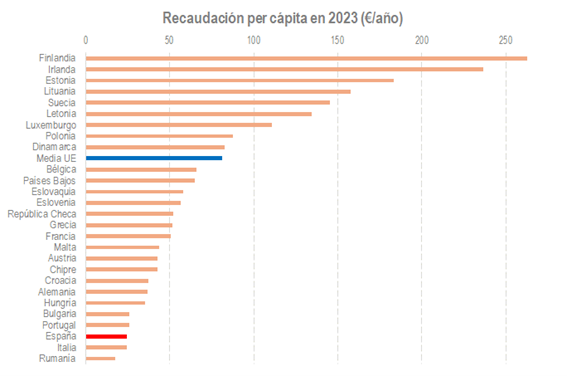
The result of these low rates is also a relatively low tax revenue far removed from the EU average, despite the impact that tourism has on our country. The following graph shows that Spain is at the bottom of the European ranking in per capita revenue.
Regarding the lack of updating of tax rates, the following graphs represent the evolution of the legal (nominal) rates of the Tax on Alcohol and Derivative Beverages and the Tax on Beer, along with the rates deflated by the CPI, which we could call real rates.
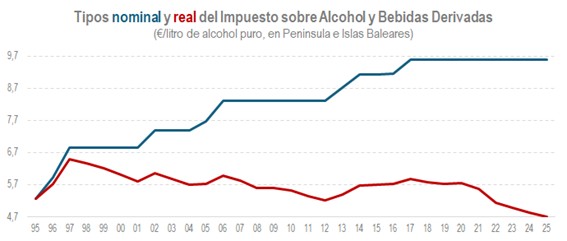
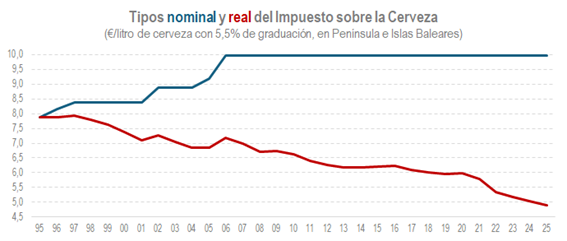
Both graphs clearly illustrate the reasons behind the loss of importance of these taxes when compared to total income. The lack of updating of the rates, in the case of beer for almost 20 years, has caused the rates in real terms to fall below what those rates meant in 1995.