Tax bases
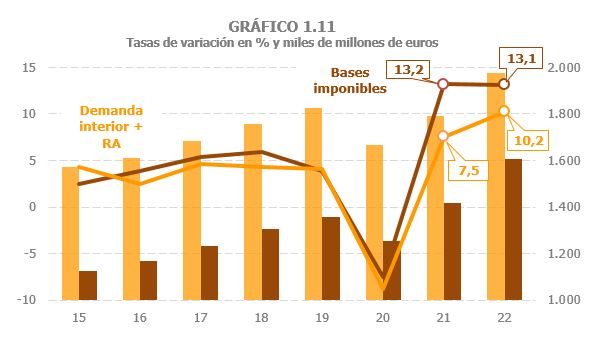
The aggregate tax base of the main taxes grew by 13.1% in 2022. This growth in the bases is similar to that observed in 2021, although it must be taken into account that in that year the comparison was made with a year, 2020, burdened by the pandemic. In 2022, however, the comparison is made with a year in which only the first part was affected by certain restrictions on activity ( Table 1.3 ).
As already noted in the analysis of the economic environment, one of the aspects that characterized the year 2022 was the strong inflationary process that began at the end of the previous year. However, this rise in prices was not the main cause of the high growth in tax bases; The main reason for this increase was the intense dynamism of income and expenditure.
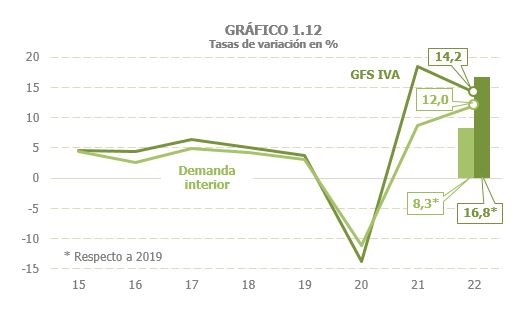
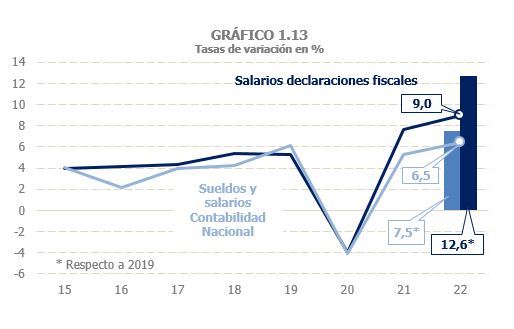
For the third consecutive year, the performance of the bases was more positive than that of the reference macroeconomic indicator usually used (the sum of domestic demand and employee compensation), so that the coherence observed between the evolution of both series until 2021 has deteriorated. As can be seen in Chart 1.11, since 2021 there has been a wide gap between the evolution of the bases and the macroeconomic indicator (in fact, in 2021 the former had already exceeded the pre-pandemic level by almost 5%, while the indicator remained below 2019 levels). As has been pointed out elsewhere, there are reasons that may help explain part of this discrepancy: There are components in the bases that either do not form part of the macro indicator (pensions, for example), or their importance within the aggregate is different from that which they have in the bases (such as the value of consumption of energy products). Even with these precautions, it should be noted that in 2022, too, discrepancies were observed between bases and very close macroeconomic variables. Such is the case of the relationship between expenditure subject to VAT and domestic demand (Graph 1.12), or the relationship between the wage bill from tax returns and salaries and wages from the National Accounts (Graph 1.13). This problem of divergence between tax bases and other estimated variables supports the idea of basing the analysis on the former so as not to introduce unknown elements that make said analysis lose coherence.
The tax bases began the year with high increases, which remained at around 16% during the first half of the year, then began a downward trend, which worsened in the last quarter, mainly in the bases linked to expenditure (Chart 1.14; The quarterly frequency data for the chart can be downloaded from this link ). This profile was conditioned by three elements: the upward effect that the comparison with a period in 2021 that was still affected by restrictions had in the first part of the year, the evolution of economic activity whose momentum slowed down in the last quarter and more moderate price increases since the end of the summer.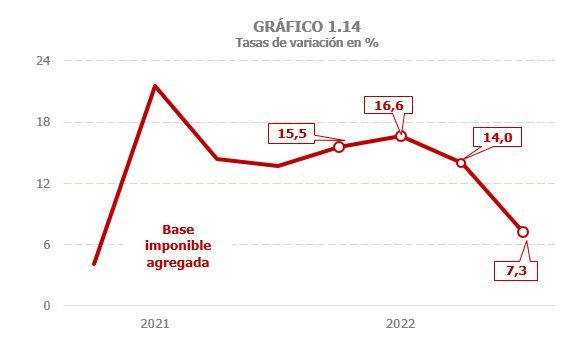
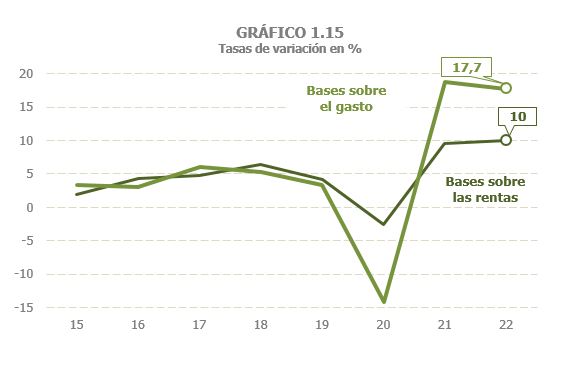
The bases linked to income closed the year with a growth of 10% (9.6% in 2021), while, in those associated with expenses, the increase reached 17.7% (18.7% a year earlier; Chart 1.15). The greatest advance in income linked to spending is due, in part, to the fact that they were the most affected by the effects of the pandemic, effects that lasted until the first part of 2021, which led to greater increases in the first quarter of 2022, both in expenditure subject to VAT and in the value of consumption subject to Special Taxes, also fueled by the increase in prices.
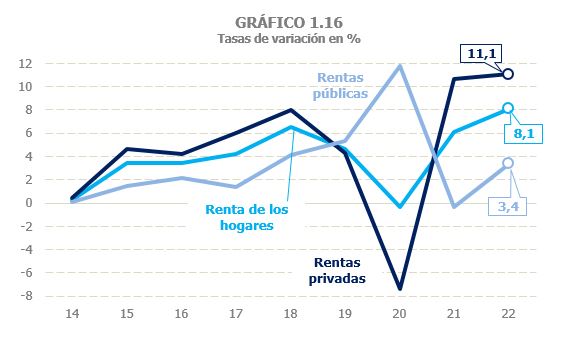
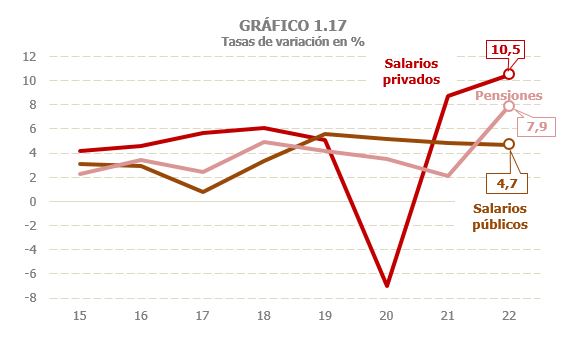
household income grew by 8.1 ( , exceeding the increase recorded in 2021 by two points. The improvement was observed in all its components, with the exception of unemployment benefits and capital gains (which in 2021 were already at figures just below the highs of 2006 and 2007). Growth was particularly strong in private incomes, around 11% for the second consecutive year, while public incomes showed a somewhat more moderate advance, as a result of the fall in unemployment benefits (Chart 1.16). The evolution of the rest of public income was positive, with a notable increase in pensions while public salaries maintained a growth rate close to 5% (Chart 1.17).
Labor income, which is the main component of household income, grew by 7% in 2022 (4.2% in 2021, Table 2.1 ). Wages and pensions grew more strongly than in 2021, while unemployment benefits decreased due to both the lower number of unemployed and the decrease in the average benefit.
Within salaries, the evolution was different depending on the sector, private or public. In the private sector, growth in 2022 was 10.5% (8.7% in 2021; Table 2.2 ). In the first half of the year, they increased by around 12.6% thanks to the positive evolution of employment, partly due to the comparison with periods affected by restrictions on activity in 2021. In the second half of the year, growth slowly moderated as job creation slowed (in the fourth quarter the rate of change was only 7.6%). In the public sector, the wage bill grew by 4.7%, a rate similar to that recorded a year earlier, although for different reasons; While in 2021 the main cause of the increase was the increase in employment, in 2022 it was the rise in average wages, especially after the additional payment at the end of the year to compensate for the rise in prices.
As regards public pensions, after the sharp increase recorded in January due to the compensatory payment associated with the price deviation in 2021, the pension mass maintained growth throughout the year of around 6.8% (over the year as a whole, the increase was 7.9%; Table 2.2 ). The average pension increased by 6.6%, as a result of this compensatory payment, the general increase in pensions established for 2022 and, as usual, the upward effect caused by the incorporation of pensioners with higher average pensions than those already in the system.
In 2022, household capital income (furniture, rents and capital gains) is estimated to have grown by 12.3%, matching the rate achieved in 2021 and already exceeding pre-pandemic levels ( Tables 2.1 , 2.4 , 2.5 and 2.6 ). This result was the result of a combination of disparate developments across different asset types. Income from movable capital grew by more than 27% after falling by 2.5% in 2021, mainly due to the positive evolution of dividends. Despite this, these incomes failed to reach the pre-pandemic level.
Income from property leasing, which since 2015 has the greatest impact on total capital income, grew by 14% (3.8% in 2021). The recovery of these rents was especially intense in 2022, observed both in the leases of premises (which are subject to withholding) and in those of homes.
Capital gains, for their part, grew by 1.9% compared to the already very high figure for 2021 (34.9%). Part of this moderation is related to the profits linked to investment funds, which fell by 20.6% after strong growth in the final stretch of 2021.
Personal business income also contributed to the good performance of household income, increasing by almost 17% in 2022, a very high growth, especially if we take into account the good result they already showed in 2021 (31%, Table 2.8 ), when they managed to far exceed pre-pandemic levels. As with private wages, the profits of these companies grew more rapidly in the first half of the year, as they were highly concentrated in activities that were particularly affected by the restrictions associated with the pandemic and which lasted until the first half of 2021. The disappearance of this comparison effect, as well as the slowdown in activity, meant that growth was lower in the latter part of the year.
The consolidated tax base of Corporate Tax grew by 20.8% ( Table 3.1 ), linking two years of strong increases (in 2021 the increase was 35.5%, although the comparison was made with the year with the highest incidence of the pandemic). Profits also grew at a good pace, by 17% (36% in 2021). These increases, already remarkable in themselves, are even more so when one takes into account that they are compared with a year in which extraordinary operations were recorded (a bank merger and the sale of assets by a large company). In the case of split payments ( Table 3.2 ), the profits of consolidated groups rose by 14.9%, reaching almost 60% for those who paid taxes according to their minimum payment, while for Large Companies not integrated into groups the increase was 19%.
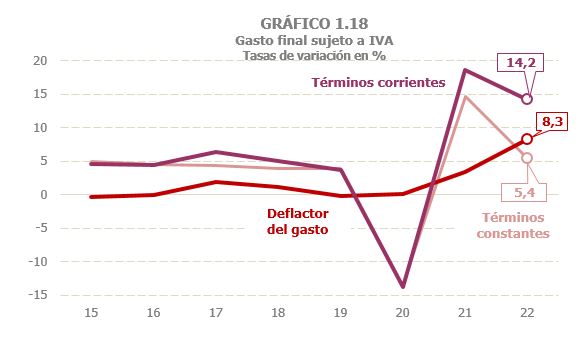
final expenditure subject to VAT grew by 14.2% in 2022 ( Table 4.1 ). As with other figures, the increase was much higher in the first part of the year (20.5% until June), favoured by the comparison with a first half of 2021 still affected by some limitations to activity and by a stronger inflationary process than that observed in the latter part of 2022. The slowdown in spending was particularly pronounced in the fourth quarter, for which an increase of 4.4% is estimated. Discounting the increase in prices, spending growth would be 5.5% in the year ( Table 4.1 and Chart 1.18). Household consumption spending was once again the component that grew the most (15.9%), after having suffered the greatest decline due to the pandemic. Despite this, it was unable to recover the weight it had on the total expenditure subject to it. Housing spending also grew strongly (12.5%), while spending by the Public Administrations, which was the only component that increased in 2020, thanks to the greater outlay associated with dealing with the effects of the pandemic, increased by 4.6% in 2022, compared to 7.3% reached the previous year ( Table 4.1 ).