The economic climate
In 2023, a gradual moderation of real activity was observed, at least until the final months when it recovered slightly. Nominal variables, however, remained high. The basis of growth was domestic demand, particularly in the second half of the year when exports began to show some weakness. The inflationary process, which was one of the most notable characteristics in 2022, was noticeably attenuated in terms of consumption and production prices, although not in terms of added value. In line with activity, the pace of job creation also slowed.
The GDP in volume closed the year with an increase of 2.5%, after starting the year at 4.1% and stabilizing the rest of the year at around 2% (Chart 1.1). In quarterly terms, growth has remained stable at around 0.5% since mid-2022. Only in the third quarter of 2023 there was a slight slowdown (0.4%) which was offset by the rebound in the fourth quarter (0.6%). The disappearance of the contribution that external demand was having until the first quarter largely explains the loss of intensity in growth (Chart 1.2).
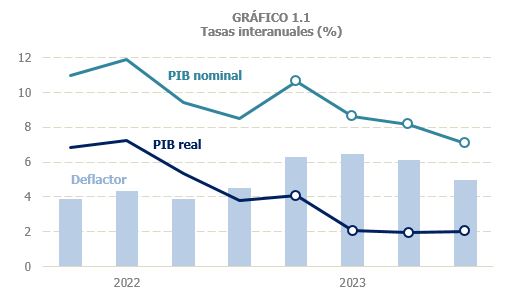

The situation is different when analyzing the variables in nominal terms, which also showed a slowdown, but not in all the variables that are relevant to the evolution of revenue collection. This is the case of the nominal GDP whose growth was 8.6%, with growth close to 11% in the first few months of the year and a progressive moderation until the end of the year at 7.1% (Chart 1.1). Domestic demand and household domestic consumption expenditure, the most useful indicators for monitoring income, grew by 6% and 7.1% respectively. Salaried workers' compensation increased by 8.8%.
A similar trend was observed in the main fiscal indicators. The daily sales of the Immediate Information Supply system of the VAT, published weekly on the website of the AEAT, allow monitoring of the evolution of the activity in real time. Chart 1.3 shows this evolution comparing 2023 and 2022.
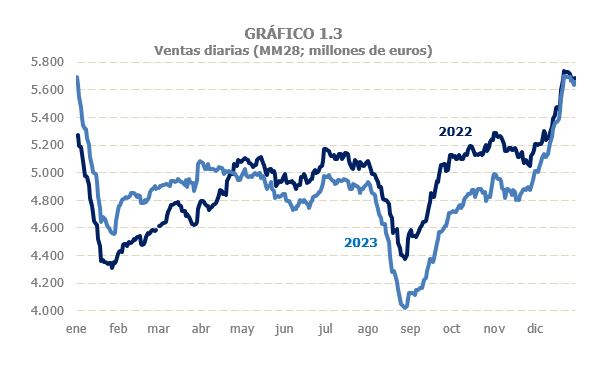
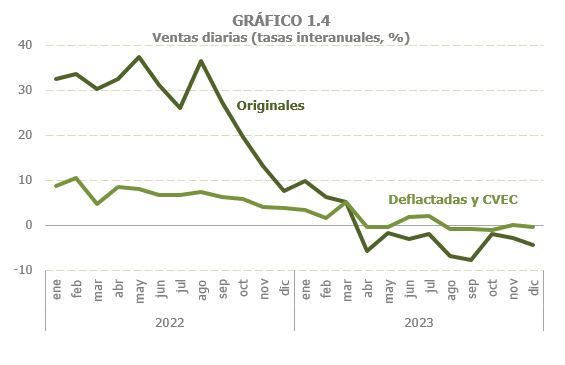
As can be seen in the chart, sales in 2023 remained above those in 2022 until the end of April. From that date onwards they began to decline and only recovered towards the end of the year. Behind this behavior are two elements that have been mentioned above: the end of the inflationary process that had characterized the year 2022 and the weakness that exports began to show. Chart 1.4 reflects the first of them. As seen in Chart 1.3, original sales, in nominal terms, decreased since April, coming from the high rates of the previous year, while deflated and seasonally adjusted sales (CVEC) remained at small growth rates, and increased over the year as a whole.
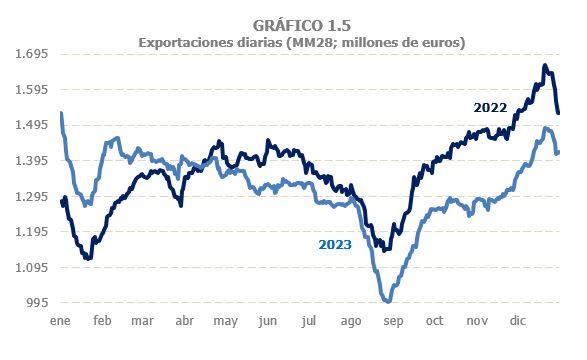
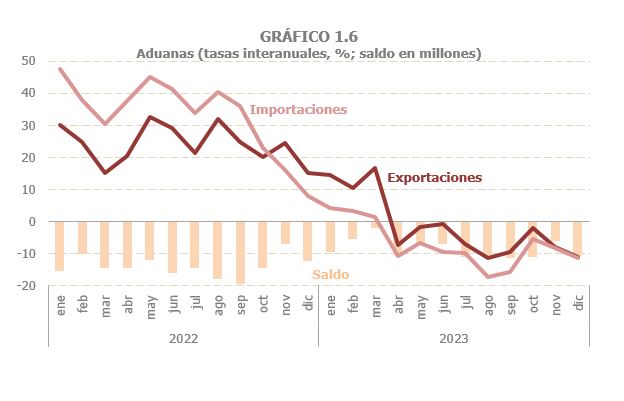
The negative trend in exports is shown in Chart 1.5. The crossover between the two years also occurred in April, but, unlike the total, the performance of foreign sales worsened in the following months. This trend can also be clearly seen in the Customs foreign trade series (Chart 1.6), which, on the other hand, was less intense than that followed by imports, which were more closely linked to energy prices. Thus, despite the poor performance of exports, the trade balance improved slightly compared to 2022.
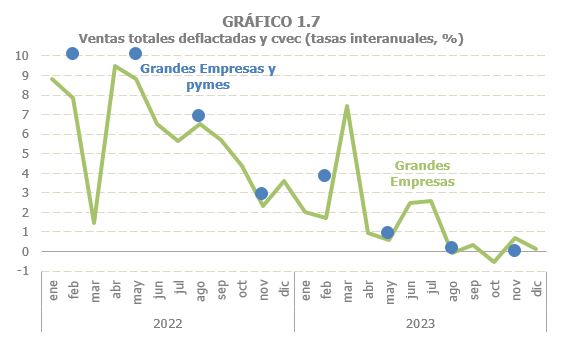
The fiscal indicator with the greatest coverage (more than 1.1 million companies), the total sales of Large Companies and SMEs corporate , also showed this deceleration profile representative of the activity in 2023. Chart 1.7 shows the monthly variation in sales of large companies. The graph serves to confirm that, despite the moderation trend throughout the year, in recent months there has been a small upturn that goes unnoticed in quarterly terms (the graph also illustrates the impact in 2023 of the transport strike in March 2022).
The price tensions evident in both production and consumption. To see this, Chart 1.8 includes indicators for both variables, industrial production prices ( IPRI ) and consumer prices ( CPI ). In 2023, the features that had stood out in 2022 were reversed.
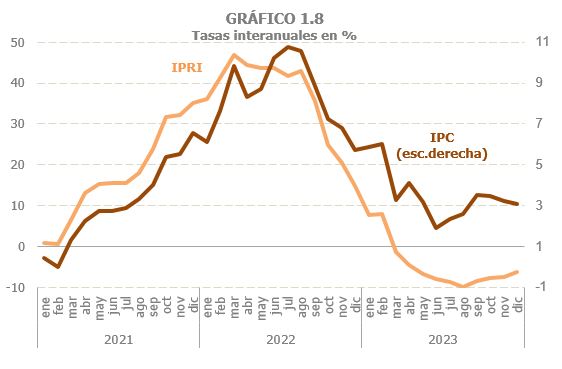
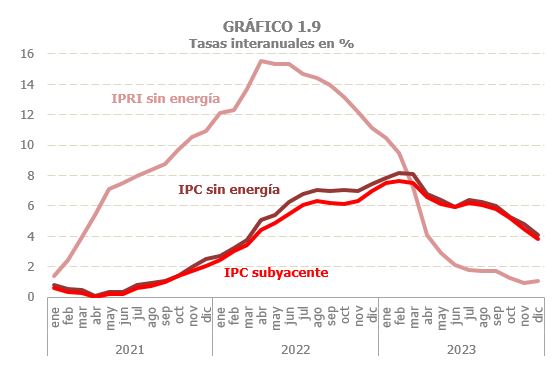
While inflation in that year was more intense in production than in consumption, in 2023 industrial production prices fell while consumer prices remained at around 3.5% since March, which was the average increase for the year. Furthermore, the non-energy component of inflation was also more persistent in consumer prices than in production prices, whose growth since mid-year was already below 2% (Chart 1.9); In consumption, however, the downward trend was slower, with prices excluding energy remaining above 6% for most of the year.
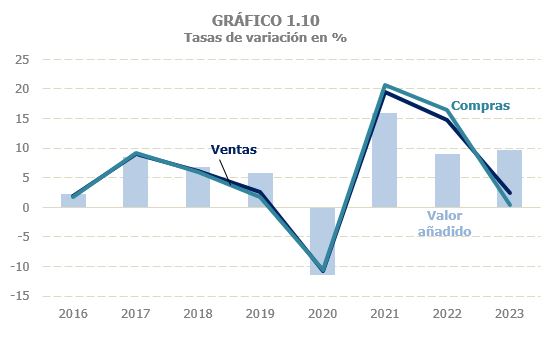
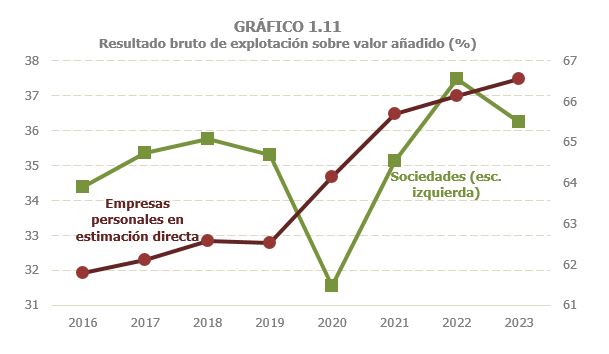
This divergence between production and consumption prices may help explain the difference in the behavior of these prices the deflator (Chart 1.1), which grew by nearly 6% in 2023 compared to just over 4% in 2022. It should be remembered that this deflator attempts to measure how the prices of added value behave, which is a different concept from the variation in production or consumption prices. Its evolution in 2023 is consistent with a reduction in production costs that did not fully translate into lower final prices, but was passed on to employee compensation and the business margin. The data provided by the Business Margins Observatory ( OME ), a joint project of the Bank of Spain, the AEAT and the Ministry of Economy, available on the websites of the first two, support this idea. Chart 1.10 shows the evolution of sales, purchases and added value of the companies included in OME . As can be seen, the sharp slowdown in sales was accompanied by a sharper slowdown in purchases, so that added value increased more than in 2022. Chart 1.11 shows the part of added value that is gross operating income, that is, the profits generated in productive activity. In the graph, the percentages observed in the companies of OME are completed with the distribution of the added value in favor of the profit of personal companies in direct estimation, information that can also be found on the website of OME as a complement to the results of the companies.
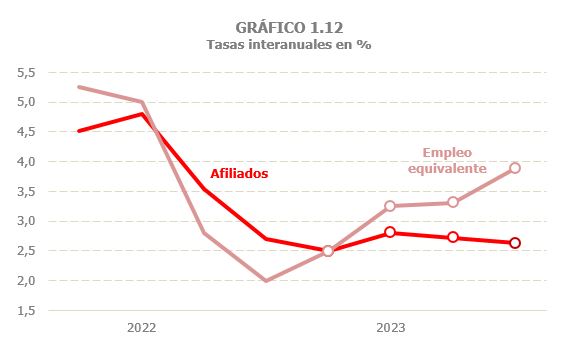
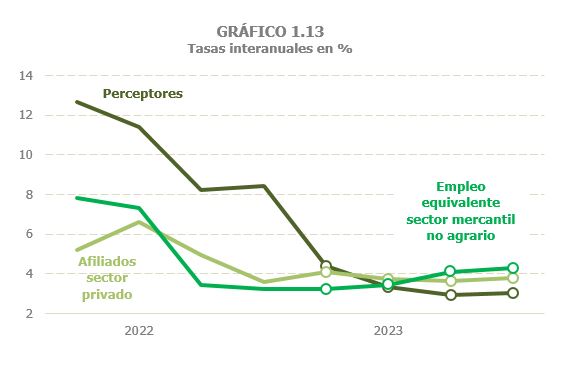
As regards employment , its evolution ran in parallel with the activity, with greater growth in the first part of the year and smaller and stable growth from the second quarter onwards. This is particularly true for employees and for indicators of a registered nature (affiliation and recipients of work income). However, the profile of the most commonly used National Accounting employment size (full-time equivalent employment) was different, with an upward trend throughout the year (derived from the more negative profile it had in 2022). Figures 1.12 and 1.13 illustrate this evolution for total employment and for wage earners.