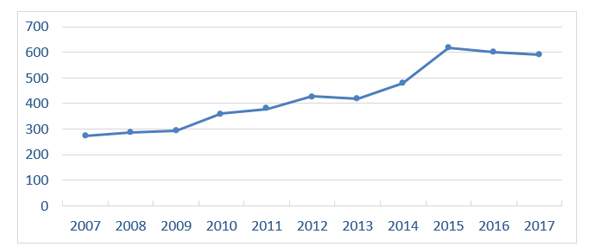
Table 9. Performance Index
|
|
2008 |
2009 |
2010 |
2011 |
2012 |
2013 |
2014(*) |
2015(*) |
2016(*) |
2017(*) |
2018(*) |
|---|---|---|---|---|---|---|---|---|---|---|---|
|
Results (millions of euros) |
8,054.03 |
8,119.27 |
10,042.87 |
10,463.00 |
11,517.28 |
10,950.18 |
12,317.72 |
15,664.00 |
14,883 |
14,792 |
15,088 |
|
Staff AEAT |
27,951 |
27,755 |
27,880 |
27,613 |
26,962 |
26,231 |
25,742 |
25,429 |
24,839(**) |
24,993(**) |
24,849(**) |
|
Revenues/Staff (millions of euros) |
288.15 |
292.53 |
360.22 |
378.92 |
427.17 |
417.45 |
478.51 |
615.99 |
599.19 |
591.85 |
607,187 |
Thousands of euros
(*) Starting in 2013, the reduction of refunds deriving from applications for rectification of self-assessments is included.
(**) Not including probationary officials 175 in 2016, 159 in 2017 and 90 in 2018.
