Chart 5. Distribution between Central Services and Territorial Services 2017 - 2018
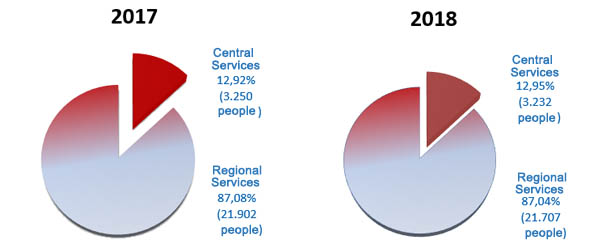
Note 1: The staff of the Central Delegation of Large Taxpayers are included in the Central Services.
Note 2: The fixed discontinuous labor staff for the Income Tax Campaign is not included.