Management of personal income tax refunds since 2000
At the beginning of June, two months after the 2022 Personal Income Tax declaration campaign (PIT), had already received their refundPIT more than 7.8 million taxpayers, which meant that at that time more than 77% of the applications submitted (10.1 million) and almost 69% of the amounts requested (about 5.4 billion of the more than 7.8 billion requested) had been paid.
It is often thought that figures like these are normal, but it is enough to look back to realise that the results recorded now are the result of the progressive improvement in management systems that allow, on the one hand, taxpayers to file their returns in advance and, on the other, to speed up the response of the administration by returning the amounts to which the taxpayer is entitled.
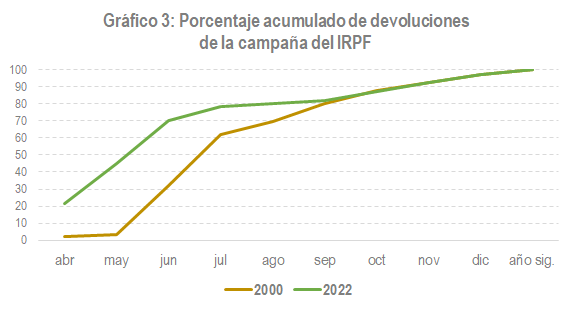
Regarding the first, Chart 1 is illustrative. It shows the evolution of the percentage of applications submitted in the first weeks of the campaign, in the first month and in the second month, always in cumulative terms, from 2013 (2012 campaign) to the campaign currently underway.
The graph shows that, over the years, tax returns have been filed earlier and earlier. The trend is clear in the line representing the accumulated percentage up to the end of May (in the period it goes from just under 50% to more than 65%), but also in the accumulated percentage for the first month, and somewhat less so in the first weeks of the campaign, although the latter accumulated percentage is decisively influenced by the start date of the campaign and the dates on which Easter is celebrated. If the amount requested was included in the graph instead of the number of declarations, the result would be practically the same.
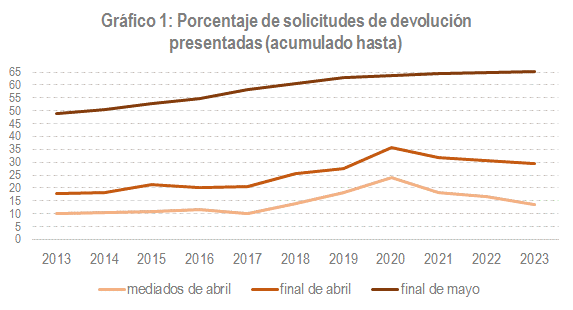
One of the reasons why there is an interest in filing returns with refund requests earlier and earlier is the acceleration that has occurred in the processing of these refunds . This information can be found in the tables and series files that accompany the Monthly Tax Collection Report . They can be used to check the amount of refunds made month by month since 1997. Chart 2 shows the percentage of amounts returned in the first month of the campaign, April, from 2000 to last year. The evolution of this percentage is a good measure of the progress made in tax management over the last 20 years.
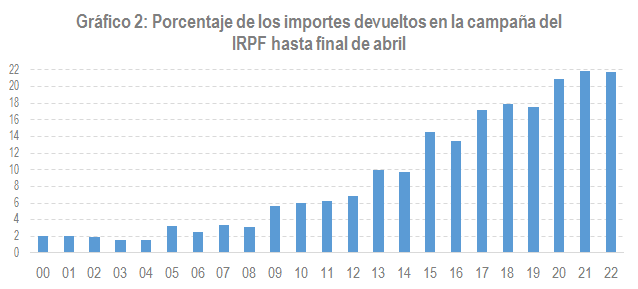
A similar conclusion is reached when analysing how the entire campaigns in 2000 and 2022 developed. This is what is done in Chart 3. The upward movement of the lines, especially in the first three months, indicates the progressive improvement in the realization of returns.