The recent evolution of economic activity and the usefulness of daily data
Tax information has become a fundamental element in understanding the economic reality of the country. The case of current information is no exception. In this sense, the daily sales obtained from the Immediate Information Supply System (SII) of the VAT. Some 65,000 companies are covered by this system, a small number compared to other indicators, also from the Tax Agency, such as, for example, sales of Large Companies and corporate SMEs, which provide information on more than one million companies. However, sales from SII account for more than two-thirds of the turnover of the total number of VAT reporting companies and, above all, the information is available in real time, so the indicator The resulting one is the most closely linked to the recent evolution of the activity.
Last Wednesday the last weekly report was published, which included the first estimate of sales for the month of April ( Tax Agency: Daily domestic sales ). Chart 1 allows us to place the result in the context of what the sales trend has been in recent months.
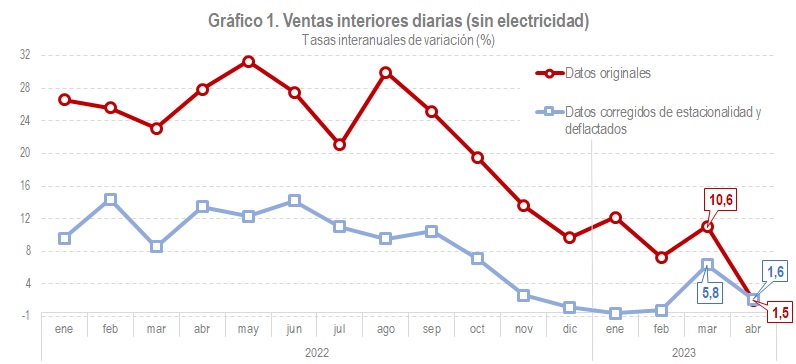
In September, a gradual slowdown in growth began, in real and nominal terms, which was more acute in this case as it coincided with lower inflationary pressure. The low was reached at the beginning of the year and the data for February and March showed an improvement. The rebound was particularly strong in March, but did not continue in April. What has happened in these two months to cause such disparate behavior?
Part of the answer can be found in Chart 2, which shows daily sales for the months of February, March and April of the last two years. The graph shows the start date of the strike in the road freight transport sector in 2022.
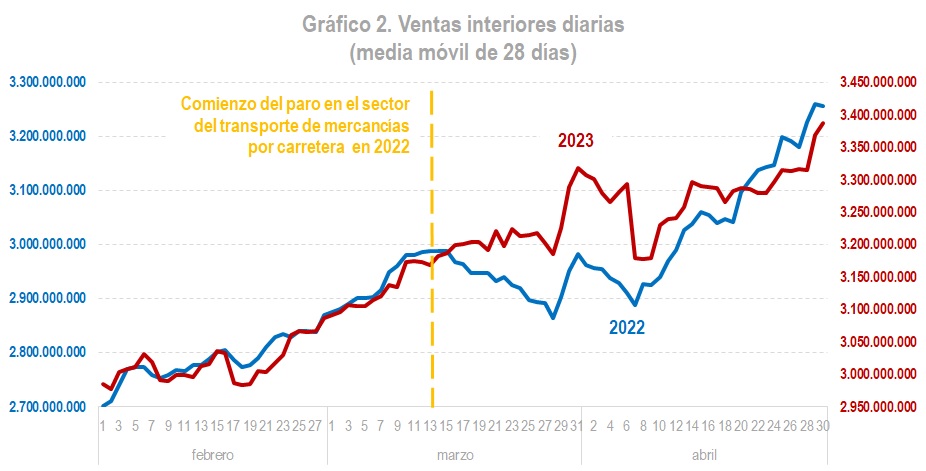
The start of the strike caused a shock to sales, from which they only recovered from the second week of April. The March figure benefited from this fact, just as the April figure has now suffered.
This is one of the virtues of daily information, being able to detect with some precision events that occur on specific dates and give them appropriate treatment. In return, the daily series are very irregular, difficult to interpret. In fact, these dates are one of the many factors that introduce noise into economic series, more so the higher the frequency of observation; Hence, it is necessary to resort to some modulation factor, as happens in the previous graph with the 28-day moving average, trying to clean up that noise. But this is not new: Quarterly series are more irregular than annual series and monthly series more irregular than quarterly series. The daily series remind us that in economic analysis we always have to debate between having information early, but with noise, or without noise, but late. The problem is that decisions cannot always wait for irrefutable data, and in such cases it is of little use to know for sure in two years what happened yesterday.