Recent evolution of income and taxable bases
On Monday, 11 September, the Monthly Tax Collection Reports corresponding to July was published. This month's data is relevant because it is one of the highest collections in the year (the second after October). In addition to the monthly declarations, in July the different declarations of the SMEs for the second quarter are presented and the first installment of the quota to be paid for the annual declaration of the PIT. Together with the report and the habitual series of income, the file of accrued taxes, rates and tax bases is also published in these months with quarterly returns (Tax Agency: Monthly Tax Collection Reports). This allows analysing the collections in further depth.
The tax revenue surged by 3.9% in the January-July period. When correcting, among other elements, the different pace of refunds in 2022 and 2023, the revenue for the same period in homogeneous terms grew 5.2%. Meanwhile, in the first half of the year the aggregate gross tax base of the main taxes increased by 7.4%.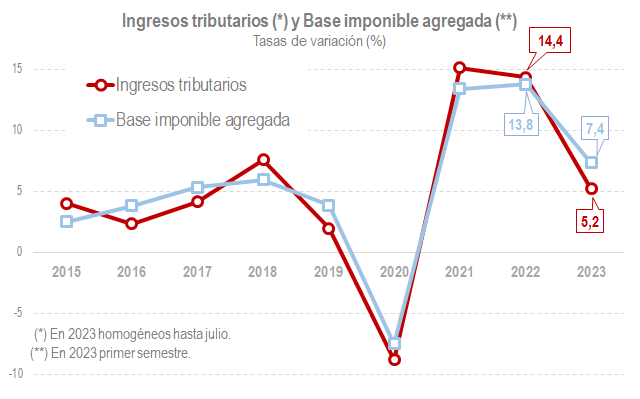
In view of the above chart, two questions arise: What is driving revenue growth?; and why this difference between the increase in tax base and the increase in revenue?
The climbing evolution in 2023 has halted, mainly, on the brisk pace shown by payroll withholdings, thanks to employment creation and the rise in salaries, pensions and the effective rate of each. In addition, the income from company earnings, specifically the instalment payments of companies, have contributed significantly. The results from the first period of the declaration of thePIT of the 2022 financial year, although, as they are accompanied by an increase in returns, their importance within the overall collection is blurred. In any case, the two main figures of direct taxation explain five points of the homogeneous revenue's growth.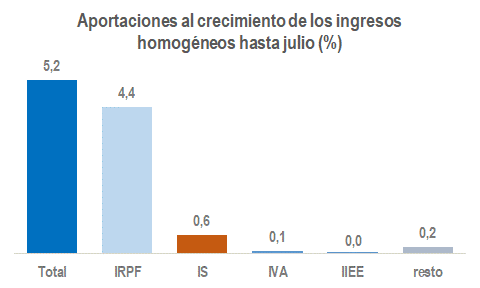
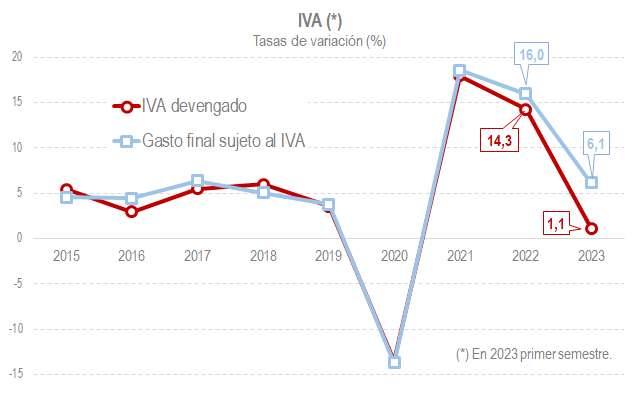
HeVAT Until July, it had a slightly positive contribution to revenue growth, despite the fact that its revenue grew modestly compared to a period in 2022 of high prices and in which all the rate cuts currently in force had not yet occurred. It is estimated that without these reductions and other measures affecting income, the VAT would be growing by 6.7% instead of the 2.1% recorded.
The impact of regulatory measures is one of the elements that mark the evolution of revenue in 2023 and which respond to the second question, why bases and income behave differently. The regulatory and management changes detracted €5,528 million to net tax revenue until July, with 3.8 points of negative impact. Among these measures, two stand out and can be analysed in detail using the file of accrued tax and tax bases: the reduction of the withholding rate in low incomes and the aforementioned reduction in VAT rates.
The following chart shows the evolution of withholding rates on salaries and pensions since 2015. In 2023, the change is similar to that experienced in 2022. However, we have to take into account that the increase in salaries and pensions is much higher in 2023, which is why, without the rate reductions on the lower incomes, the increase would have been higher than in 2022.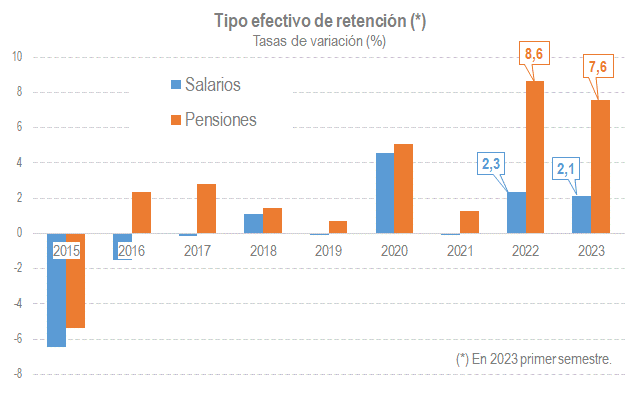
As for the VAT, the following graph shows the evolution of expenditure subject to tax and ofVAT accrued. The difference between both series measures the drop in the rate. It is estimated that the drop in the first quarter was 5%, 4 points from the reduction of rates in energy and basic foodstuffs and an additional point caused by the higher increase of prices in goods and services subject to the discounted and ultra-low rates.