First data on company profits in 2023 from their accounting information
Once the annual income tax and corporate tax returns have been submitted, the first information on the evolution of business results in 2023 is available from company accounts.
It should be remembered that the monitoring and analysis of business profits based on tax information can be done through the Business Margins Observatory , the project developed by the State Tax Administration Agency together with the Ministry of Economy, Commerce and Enterprise and the Bank of Spain, and which has been discussed in various newsletters since its first publication. The new data released for companies and personal businesses for 2023 replaces the advances in business results that were made throughout that year with information from VAT models, withholdings on employment income and fractional payments of personal income tax.
The evolution of business results since 2009, including the year 2023, is shown in the following graph:
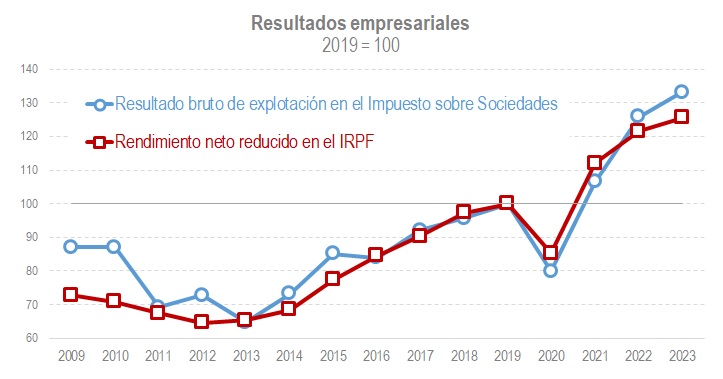
As can be seen, in 2023 the upward trend that has generally been maintained since 2013 with the abrupt interruption in 2020, the year of the pandemic, has continued. It should be noted that, given the characteristics of the presentation of the Corporate Tax (according to the fiscal year, which does not always coincide with the calendar year), at this time only the information is available for a constant population (the set of companies that filed declarations in both 2022 and 2023 until the end of July), which has traditionally proven to be a good indicator of what the results will be when the full population is available.
In nominal terms, the upward trend in the level of results is not very indicative of the behaviour of profits. It serves to show the recovery of the trend that occurred after the crisis caused by Covid, but little more. Another approach is to measure the year-on-year change in profits, as shown in the following graph.
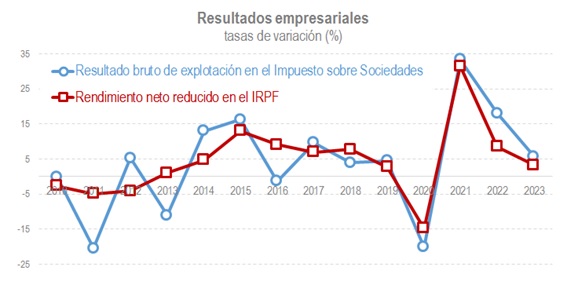
Looking at the graph, it can be concluded that, although business results have indeed continued to grow, in 2023 they did so at a slower pace than in previous years. The slowdown is related, first, to the high growth that took place in 2021, logical in comparison with an atypical year such as 2020, and, second, to the inflationary tensions that characterized 2022, particularly in the energy sector.
When working, as is the case, with nominal variables, it is normal to deflate them to get an idea of the real evolution. However, in the case of profits this does not make sense since it is a variable that influences the formation of prices; That is, its evolution is not immune to price increases. The translation of benefits into prices can be analysed with simple arithmetic (some examples can be found on the observatory portal hosted on the Bank of Spain website) and with the help of appropriate price indicators (a ## file with these prices can be found in the AEAT Observatory).
If you do not want to follow this route, the alternative is to analyse profit margins by relating profits to other variables of the company's activity, such as sales or added value. In the first case, the margin on sales is useful, in principle, to analyze the transfer of production costs to sales prices. The graph below shows the evolution of this margin, both for the total and for the aggregate without energy.
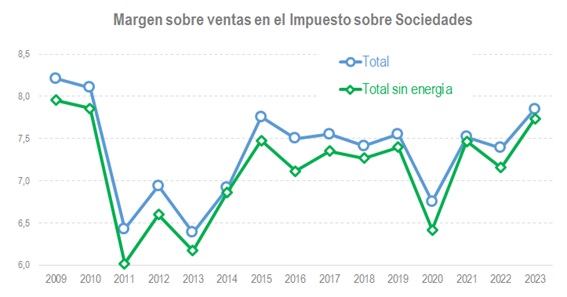
The chart shows that in 2023, profit growth outpaced sales growth, especially excluding the energy sector, reaching the highest level since 2010. It would also indicate, in the first instance, that part of the increases in final prices have to do with the improvement in margins. However, with this margin, the conclusions are not straightforward if the evolution of costs is not also analysed, even more so in the last two years in which, as can be seen in the following graph, very different sales and purchasing behaviours have given rise to added value with equal growth in both years.
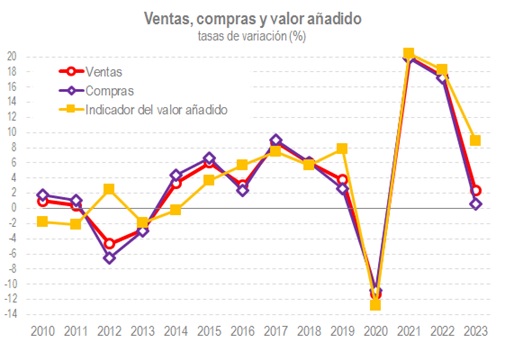
The study of the behaviour of profits must be completed with the analysis of the other margin, the margin on added value, which adds to the previous one the vision of the distribution of the generated income (of the added value) between the labour factor and the capital factor.
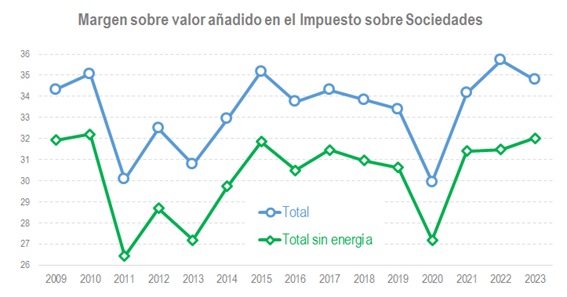
The first data for 2023 would indicate that, excluding energy, a peak in the distribution of added value in favour of capital would have been reached, similar to those reached in 2010 and 2015. Almost the same can be said for all activities, although in that case the peak would have been reached in 2022 coinciding with the high prices of energy goods.