Tax revenues for the year 2024
The recently published Annual Tax Collection Report for 2024 summarizes all the relevant information from last year, once the information forms that complete the data from the periodic declaration forms that were already available at the end of March, when the monthly reports for December, January, and February were published, were received and processed. The annual report is also complemented by notes that provide further details on specific aspects of revenue collection.
Tax revenues in 2024 amounted to €294.734 billion, representing an 8.4% increase compared to 2023. As reflected in Chart 1, the basic argument for revenue growth was the increase in tax bases. These grew by 6.9%, although if the portion referring to the value of products subject to Special Taxes (whose evolution is conditioned by the behavior of energy prices, which for the most part do not influence the revenue from these taxes) is not considered, growth would rise to 7.7%.

Revenue increased more than the aggregate tax base (almost the same, given the clarification just mentioned), even though, as in 2023, revenue was limited by the negative impact of regulatory and management changes, which together amounted to just over €2 billion (without them, revenue would have grown by 9.1%). The intensity of income growth is also evident when compared with current domestic demand, which is derived from the National Accounting aggregates and is the closest indicator of this to the evolution of the bases. Following successive revisions to the national accounts, this indicator appears to have returned to its previous trend over the past three years, close to the baseline, although the discrepancy between 2020 and 2021 remains, meaning that, when measured against 2019, domestic demand is lagging around 10 points behind revenues and baselines.
The economic environment in which tax collection developed in 2024 was characterized by an upward trend in activity since the beginning of the year and the end of the inflationary tensions of previous years, at least until the last few months, when there was a slight rebound. The indicator that best illustrates the progress of the activity is the quarterly sales of Large Companies and SMEs, the one with the greatest coverage of those existing in the statistical panorama. This is reflected in Chart 2, which clearly shows the change in trend between 2023 and 2024. Last year's annual report already warned of the signs of recovery that could be seen in the final months of 2023. These signs were quickly confirmed at the beginning of 2024, before consolidating an upward trajectory throughout the remainder of the year.

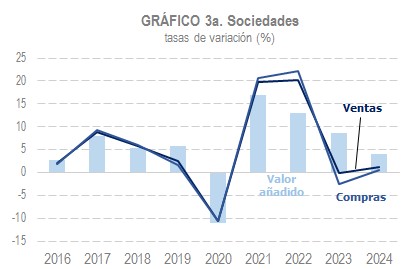
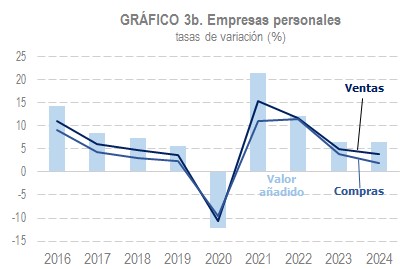
The evolution in current terms, similar to that provided by the National Accounting, can be followed with the data provided by the Tax Agency within the Business Margins Observatory. This information allows for a detailed analysis of the added value generated by corporations and personal businesses in direct estimation, with quarterly frequency and sector-by-sector detail. Chart 3 shows the evolution of sales, purchases and added value in these two groups of companies (3a companies and 3b personal companies). As can be seen, in 2024, added value followed a similar deceleration pattern to that of nominal GDP, more intensely in corporations than in individual businesses, where the increase in added value was almost the same as in 2023.
One of the features of 2024 was the narrowing of the gap between the behavior of direct and indirect tax revenues that distinguished the previous year. The increase in direct taxes (Chapter I) was 9% (10.1% in 2023), while indirect taxes (Chapter II) increased by 7.5% (1.7% a year earlier).
In the three major figures (personal income tax, corporate tax and VAT), the evolution was as follows. Personal income tax revenue grew by 7.6% in 2024. The regulatory changes resulted in a loss of approximately 3.2 billion euros, meaning that, without this impact, revenue growth would have been 10.2%, a figure consistent with household income growth of around 8.5% and the increase in the effective rate resulting from the rise in wages and pensions. In addition to the favorable trend in withholdings from employment income, income from capital gains also increased thanks to the continued recovery in bank account interest and the positive performance of dividends. The 2023 annual return, on the other hand, showed negative results due to low growth in income from economic activities, a decrease in capital gains (especially those from the sale of real estate), and refunds to mutual fund members resulting from the rulings on this matter.

Corporate tax revenues grew by 11.5%. In this case, too, regulatory and management changes worked against revenue collection, reducing it by more than 2.1 billion. Corporate profits are expected to rise by over 13% in 2024, while the consolidated tax base is expected to rise by 10.8%, following three years of strong increases (36% in 2021, 17.7% in 2022, and 11.4% in 2023). The increase in tax collection was primarily driven by installment payments, which grew by 11.1%, in line with the profits reported by large companies and groups. As with personal income tax, capital withholdings also had a significant contribution, and the annual return's results were negative. This year, primarily due to the increase in refund applications for the 2023 tax year (the tax return that began to be filed in July 2024), affected by the abolition of the limitation on past losses following the Supreme Court ruling and the earlier pace of these refunds.

In the case of VAT, revenues grew by 7.9%. Final expenditure subject to tax increased by 5.7%. The remaining increase in revenue is explained by the gradual elimination of interest rate cuts on energy products, in addition to other measures with a positive impact on revenue. In total, all of these elements increased revenue by more than 1.7 billion. Chart 7 clearly illustrates the impact of the measures taken since 2021 to mitigate rising energy and food prices and the gradual return to normality in 2024.
