When do taxpayers file their tax returns?
The 2024 income tax campaign will conclude in the coming days. The campaign began on March 12 with the opening of the application process for a reference number. A week later, tax data was accessible, and on April 2, tax returns could be filed through the app. Rent WEB.
Campaign results can be monitored in a variety of ways. Firstly, timely information is provided on the progress of the filing of declarations and, in particular, on the implementation of the refunds requested in the Press releases. On the other hand, the monthly collection reports Since May, they have included a section where the campaign is monitored in relation to the income and refunds made up to the corresponding month and the pace at which the refunds are being executed and the payments are being made is analyzed. In it annual report The campaign is then placed in the context of the entire Personal Income Tax and, finally, Statistics on Personal Income Tax tax filers It collects all the detailed information on the declarations submitted for each fiscal year (the results for 2023 will be published shortly).
One question of interest is when taxpayers file their returns: Do they all do it in the end? Are tax returns filed with favorable results much earlier? Do people who are due to pay their tax returns wait until the last days of the campaign? A quick answer to all these questions would be that the expected behaviors occur a priori (for example, returns to be returned are submitted before those with a result to be entered), but the differences are smaller than one might assume. Furthermore, the pattern of filing returns has generally remained fairly stable over time, although there is a slight tendency toward earlier filing times.
Although day-to-day monitoring suggests that the results from one year to the next are completely different, once the campaigns are viewed with greater perspective, the conclusion is that the filing of tax returns follows a very similar pattern every year, regardless of the growth trend in tax returns or the fact that the amounts to be paid or refunded may be very different from one year to the next. This first graph, which shows the percentage of returns filed in the last eight campaigns divided into the three months in which they occurred, serves as an example.
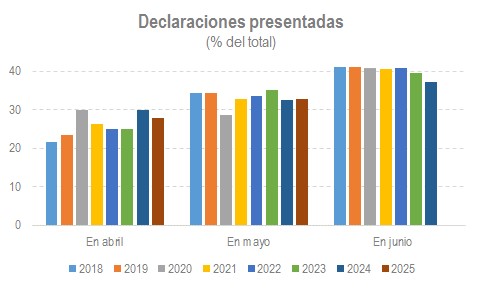
The graph shows the percentage of returns filed in April, May, and June (which includes the first few days of July to account for years in which the campaign ended slightly later due to calendar reasons). As you can see, there are oscillations, but with reduced variability. Logically, the greatest differences occur in April, which is the month most affected by the calendar. Thus, it is possible to find campaigns in which the presentation began on April 1 (2020) and others on April 11 (2023), with the addition that in some of these years Holy Week took place in the middle of the campaign (2019, 2020, 2022 and 2025). Within the stability noted, a slight trend can be seen, particularly visible in the June data, toward earlier filing of tax returns.
Stability is not only observed in the data aggregated on a monthly basis, but also when these same percentages are calculated on a daily basis. The following chart shows the percentage of returns filed on each day of last year's campaign.
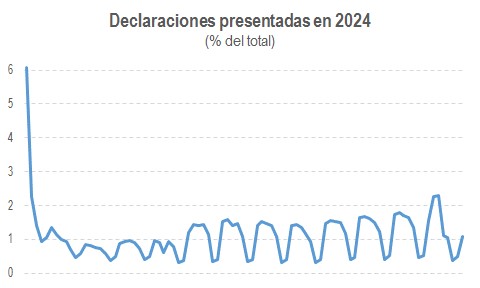
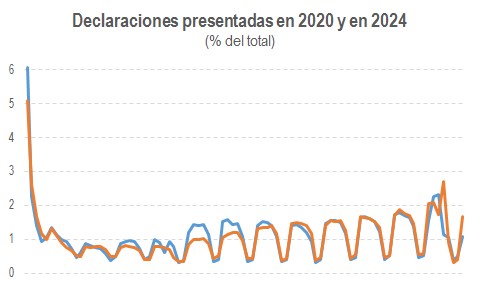
The pattern is clear: a high number of submissions in the first few days, which stabilized at just under 1% in the following days and followed an upward trend until the end of the campaign. Even within the weeks, it can be seen that, recurrently, there is a higher presentation in the first half and a drastic decrease on the weekend. It is the pattern that is seen every year. The following graph compares the year 2024 from the previous graph (blue series) with what happened in 2020 (orange series). Similar results are found in the rest of the campaigns.
Logically, the filing rates are not the same for returns with a refund request or with a result to be paid or zero. The following charts show the same information as the initial chart, but now with a breakdown based on the sign of the declaration result.
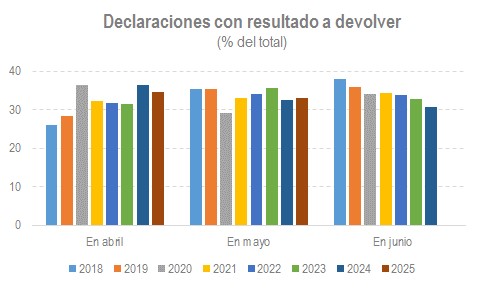
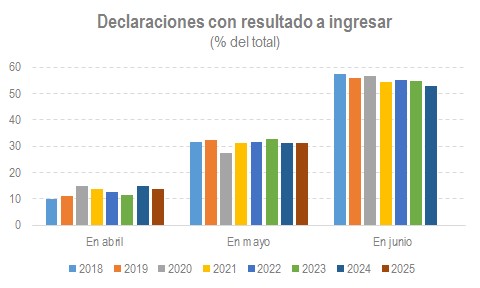
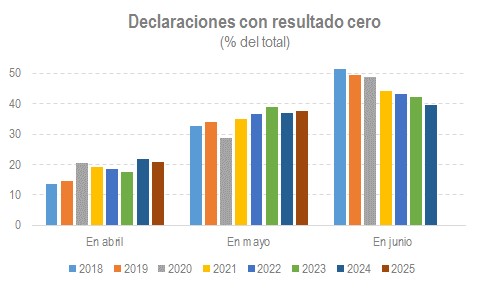
As expected, the number of returns to be filed shows a greater accumulation in the latter part of the campaign, but this effect is not as pronounced as one might assume. In other words, people who find it difficult to pay do not overwhelmingly wait until the last minute; On the contrary, more than 40% file their declaration in the first two months of the campaign. And something similar can be said about the declarations to be returned: They do not occur as early as possible, but are spread almost evenly over the three months. In any case, all the results show the aforementioned tendency to bring forward the presentation.