4. Valued Add Tax
VAT collection increased by 14.5% in 2021, reaching 72,498 million, and was 1.3% above what was received in 2019.
The improvement in subject spending was reflected in the positive evolution of gross VAT, which grew by 11.9% ( Table 4.2 ), exceeding the amount reached in 2019 by 1.4%. Obviously, much of the evolution of gross income is strongly conditioned by the trajectory of 2020. Thus, the year began with 3.2% growth, followed by a strong rebound in the second quarter, in response to the months of strict confinement in 2020, but even with this intense growth, by mid-year the income level of two years earlier had not yet been reached. In the second half of the year, gross revenue growth accelerated, allowing the company to close the year with revenues almost €5 billion higher than in 2019. Part of this increase was due to the price increase that occurred during this period, especially in the last months of the year (Chart 4.1), although it should be noted that the reduction in the rate for domestic electricity consumption, which subtracted more than 500 million from revenue, partially cancelled out the increase in prices. The growth in gross revenue was accompanied by a slight increase in returns, which rose by 6%. It is worth remembering that a large part of the refunds paid in 2021 (around 55%) are not related to what happened during the year, since they correspond to refunds requested in other years or to regional adjustments. These returns increased by 7.1%. Furthermore, the effect of the price increase at the end of the year, and the resulting increase in costs that resulted in a rapid increase in refund requests in that period, was mostly carried over to 2022, when the last accruals for 2021 were submitted.
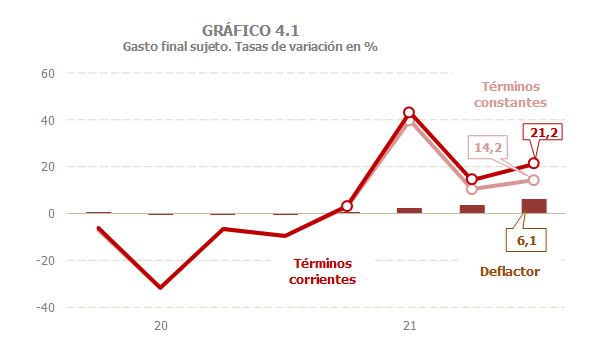
final expenditure subject to VAT increased by 19.3%, in line with the general improvement in the economic context. After the abrupt rebound in the second quarter, a response to the contraction suffered in the same period of 2020, there was a notable acceleration in the second half of the year, part of which was due to the already mentioned increase in prices (3.3% annually, Table 4.1 and Chart 4.1).
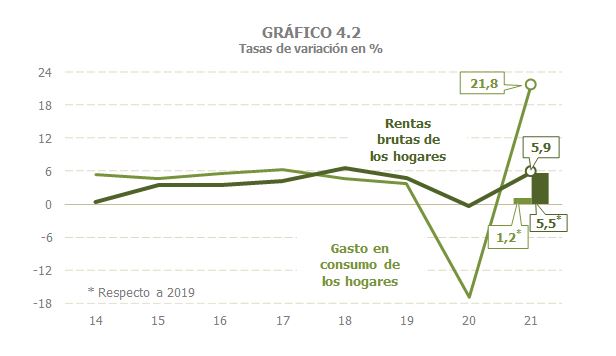
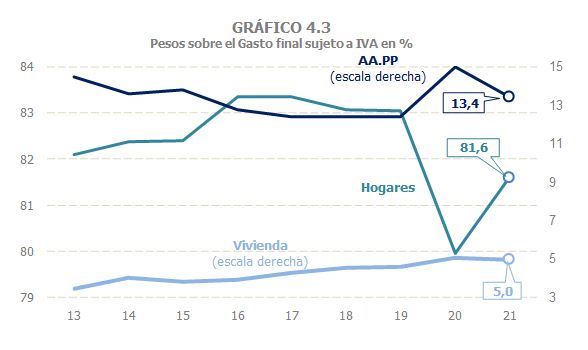
Household consumption expenditure was the component that experienced the strongest recovery (21.8%), after having been the most affected by the pandemic. The usual synchrony between the evolution of gross household income and their consumption expenditure was broken last year as a result of the lockdown and other limitations that intensely affected this component. In 2021, the gap between the two widened even further, so that while gross household income grew by 5.9%, their consumption spending rose to 21.8% (17.7% without the effect of price increases). If the comparison is made with respect to 2019 levels, this gap narrows: Gross household income grew by 5.5% while spending grew by 1.2% (Chart 4.2). However, the recovery in household consumption spending was not sufficient for it to regain its weight in total subject spending, remaining more than one and a half points below the average observed in the previous four years (Chart 4.3). Spending on new housing also experienced a strong rebound (16.4%, 11.2% compared to 2019), in line with the recovery in new housing sales. Finally, the expenditure of the AA.PP. maintained its upward trend, with a growth of 7.1%, as it continues to be conditioned by the greater outlay associated with dealing with the effects of the pandemic.
The effective rate of VAT remained practically unchanged for another year (-0.1%, Table 4.1 and Chart 4.5 ). In 2021, there were several regulatory changes that affected the type: the increase in the VAT rate on sugary and sweetened beverages, the reduction in the VAT rate on electricity and surgical masks, the maintenance of type 0 on essential health supplies to combat COVID 19 and the extension to vaccines and PCR. All these measures had an impact estimated at a loss of 186 million ( Table 1.5 ), which was not enough to significantly impact the evolution of the average rate.
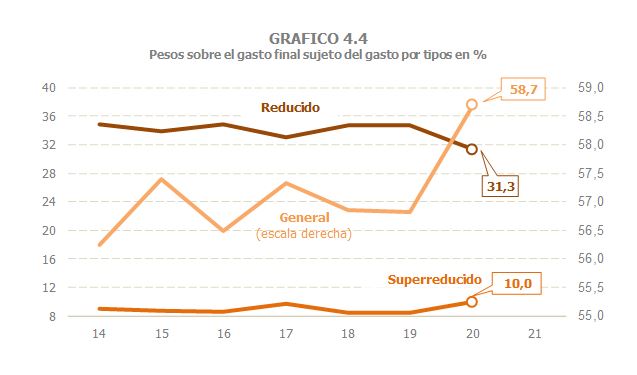
What has been clearly affected by the pandemic has been the composition by types of the final expenditure subject, as analyzed in Table 8.7 . Thus, while in the period 2014 to 2019 the weight of general rate expenditure on the total final subject expenditure remained at around 57%, in 2020 this weight increased to 58.7%, while the weight of reduced rate expenditure (associated among others with the sectors most affected by confinement measures and other limitations), was reduced by three points, going from representing around 34.3% of the total subject to representing 31.3% (Chart 4.4). This situation is expected to have been partially reversed during the 2021 financial year (information available at the end of 2022).
Given the practical stability of the effective rate, the VAT accrued in the period increased by 19.2%. The net VAT accrued (which differs from the previous one because it includes the variation in the balance that companies leave to compensate from one year to the next) grew a little less, 19%, 3% compared to 2019.
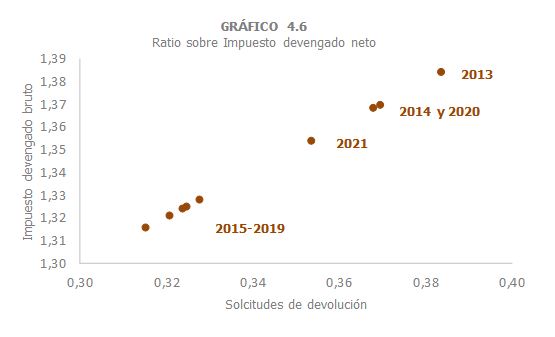
Gross VAT accrued increased by 17.8%, 5% compared to 2019 ( Table 4.2 ). In the same way that its deceleration in 2020 was somewhat less abrupt than that recorded by the net accrued VAT, the recovery in 2021 was also somewhat smaller, reducing the gross VAT / net accrued VAT ratio, although this ratio does not reach the environment of those observed from 2015 (the year in which Customs VAT began to be settled through self-assessments) until the start of the pandemic (Graph 4.6).
The acceleration of gross accrued VAT was more intense in the quarterly declarations (18.6%), which are those that have a greater connection with the activities that were hardest hit by the drop in activity and consumption in 2020. For their part, monthly declarations, which group together Large Companies, groups and other operators covered by the monthly refund regime, together with import VAT, increased by 17.3%.
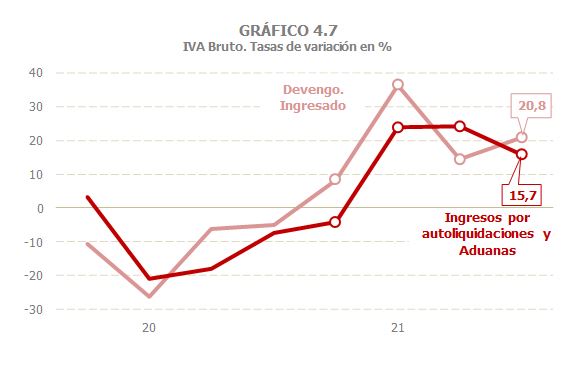
Gross income increased by 11.9%, almost six points less than the gross VAT accrued (17.8%), and this despite the fact that the part of this VAT that is declared to be paid grew even more (19.4 %, Table 4.2 ), favored by the improvement in the economic situation that reduced the amount of requests for deferral and inability to pay. There are two reasons for this lower increase in cash income. On the one hand, the mechanics of the tax itself, which means that practically all of the income for the first quarter of 2021 corresponds to accruals from the end of 2020, affected by limitations on mobility and other restrictions. Thus, the entry of quarterly declarations corresponding to the accrual of the last quarter of 2020 is shifted to the first quarter of 2021, to which is added that, since the entry into force of the SII, most of the monthly declarations shift their entry into cash two periods. In the same way, most of the income associated with VAT accrued in the last quarter of 2021 (which registered a notable acceleration in line with the already mentioned evolution of subject spending in real terms and prices) has shifted to the first quarter of 2022. Chart 4.7 shows this gap between the accrual to be paid (not including deferral requests) and the recording of its cash income, which explains why the former recorded an annual increase of 19.4%, compared to 13.6% of income ( Table 4.2 ; chart data can be downloaded from this link ).
The second cause of the lower growth in gross income is the drop in revenue associated with fewer deferrals requested (-10.9%; remaining income of Table 4.2 ). It should be noted that last year this concept had a very high level due to the payment deferral measures that were taken in the early stages of the pandemic. In 2021, the recorded amount is of the same order as that observed before 2020.
Refund requests rose by 14.4%, following a decline of almost 3% last year. Annual refund requests, which are more closely linked to the reduced rates at which smaller companies sell, increased by 17.0%, driven by rising costs, while monthly requests, more closely related to exports, grew by 13.7%, a rate that almost doubles the average increase observed in the period 2017-2019.
VAT refunds grew by 6% in 2021, with advances of around 2% in both annual and monthly refunds and a strong rebound in refunds due to regional adjustments (45%, more than 1,100 above those paid in 2020). The increase in annual refunds is due to the higher amount requested in the 2020 financial year, most of which was paid in 2021, coupled with a high rate of realization (you have to go back to 2008 to find a higher rate of realization). As for monthly refunds, the increase is explained by the higher amount requested in 2021, since the rate of completion was around 6% lower than that recorded in the previous five years, in addition to the fact that the amount paid for those requested in 2020 also decreased.