Tax bases
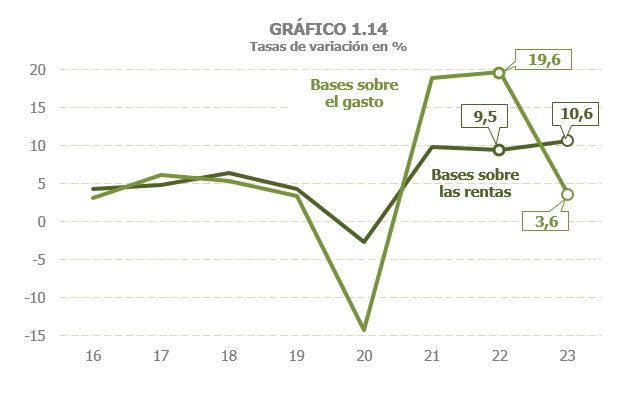
The aggregate tax base of the main taxes grew by 7.6% in 2023, six points below the rate reached in 2022, a year with strong price tensions and which was compared to a year 2021 that had not yet returned to normal ( Table 1.3 ). As a result of these two circumstances, the slowdown was concentrated in the bases associated with expenditure (3.6% compared to 19.6% in the previous year), while the bases related to income exceeded by more than one point the figure observed a year earlier (10.6% compared to 9.5%, Chart 1.14).
The lower growth in expenditure-related bases is due, on the one hand, to the lower incidence of inflation, especially that associated with energy, which reduced the value of consumption subject to special taxes and, on the other hand, to a more moderate increase in expenditure subject to VAT.
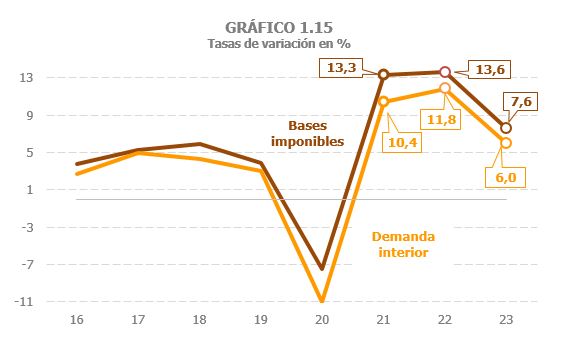
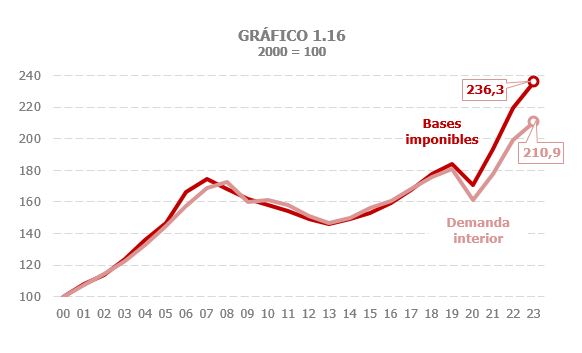
In 2023, the gap observed between the evolution of the bases and that of the commonly used macroeconomic reference indicator, domestic demand, narrowed, although the performance of the former continued to be more positive than that of its indicator, as can be seen in Chart 1.15. Part of this discrepancy is explained because there are components in the bases that either are not part of the macro indicator or their importance within the aggregate is different from that in the bases, but even taking these factors into account, the different evolution between bases and indicator in the indicated period represents an anomaly in the history of both series, as reflected in Chart 1.16, which shows the behavior of both aggregates in the last twenty-four years, taking 2020 as a base.
The aggregate tax base began the year with a growth two points higher than that of the last quarter of 2022, an increase explained by the favorable evolution of income and expenditure subject to VAT. However, in the second quarter, the growth of the bases slowed down, with the exception of gross household income, which maintained growth of around 9.5% compared to 7.8% in the first quarter. During the second half of the year, the aggregate base once again recovered a greater intensity of growth, especially in the fourth quarter, driven by the good performance of the corporate tax base, the improvement in final subject expenditure and the smaller fall in the value of subject consumption. II. Excise Duties, factors that offset the slower growth in gross household income. (Chart 1.17; The quarterly frequency data in the chart can be downloaded at This link to the file of historical series of bases, rates and taxes accrued).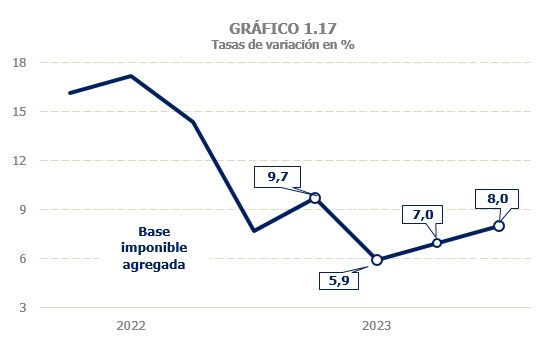
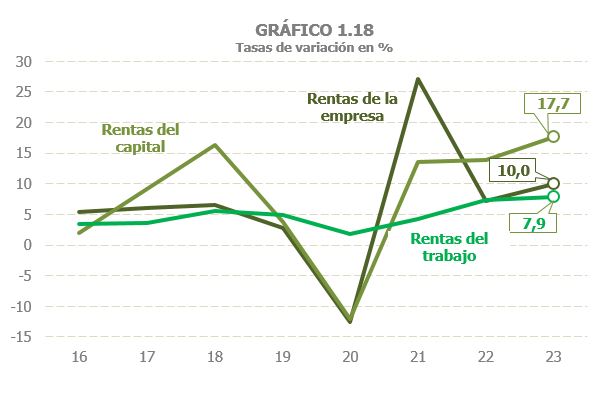
household income grew by % in 2023 ( ), more than one point higher than the previous year's rate. The largest contribution to growth was made, logically given that it is the main component, in labour income, although the increase was greater in capital income and income from economic activities (Chart 1.18).
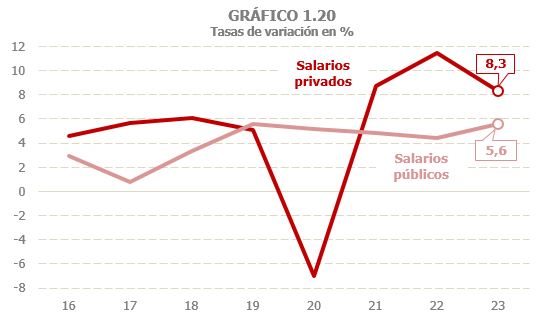
Income from work and economic activities grew by 7.2% in 2023, a rate just four-tenths lower than that at the end of 2022 and which is the result of disparate developments between its components (Chart 1.19 and Table 2.2 ). Thus, the wage bill increased by 7.6%, which was a significant increase compared to the average increase for the period between 2015 and 2019, which stood at 4.6%, but which implied a slowdown of two points compared to the rate reached in 2022, a slowdown that was concentrated in the private sector (Chart 1.20). Its evolution throughout the year was one of slight deceleration as a result of the progressive moderation in the pace of job creation and wage increases that were lower in the second half of the year (they went from growing around 5.5% in the first half to around 4.5% in the second). This profile was clearer in the private sector and, above all, in the SMEs where the slowdown in employment was most noticeable. The payroll of Large Companies grew by 9.6%, compared to 11.1% in 2022, while in the case of SMEs the increase was 6.6%, with a slowdown of more than five points compared to 11.9% a year earlier. For the year as a whole, private wages increased by more than 8% (11.4% the previous year). In public salaries, growth was also higher in the first part of the year, but in this case the slowdown had more to do with the intensity and way in which salaries were updated in 2022 and 2023 (in the first the correction was greater and in November). The final result for the year was a 5.6% increase in public payroll.
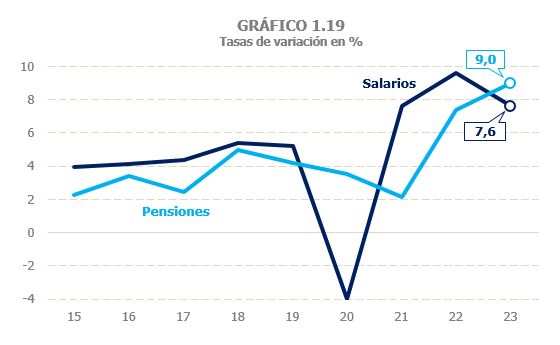
Unlike what happened with the wage bill, the pension bill grew in 2023 by more than one and a half points above the rate reached in 2022, 9%. The increase in public pensions was 9.4% and 11% since February (the rate for January was negative when compared to the month that included the last update payment due to the price deviation). The private pension stock fell again, although less sharply than in recent years. The weight of these pensions on the total mass has been reduced over the years, so that in 2023 they represented around 3.5% of the total.
The last major element of these benefits, unemployment benefits, increased by 3.2% in 2023, after registering sharp declines in the two years following the crisis caused by COVID .
Household capital income (furniture, rents and capital gains) grew by around 20%. Income from movable capital increased again by around 30%. New in 2023 was the contribution of interest from bank accounts. In 2022, growth was due to the expansion of dividends compared to 2021, which reflected the effects of the 2020 crisis on profit distribution. In 2023, dividends also grew, but more moderately, and it was the interest from bank accounts that led to the rise in these incomes. The starting situation was very low (not the historical minimum because the rise began to be noticed in the last months of 2022), but the increase was very significant, enough to raise these remunerations to levels higher than those in 2016 (Chart 1.21).
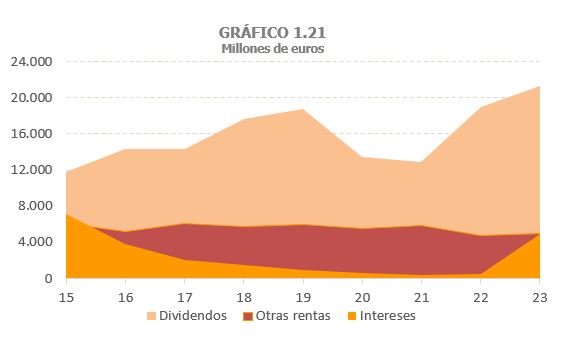
In 2022, rental income also recorded relatively high growth compared to 2021, although there has not yet been a full recovery. In 2023, growth continued above 8%. As for capital gains, they rose again by over 17% in 2023 thanks to the performance of the housing market and the stock market, and despite the fact that gains on investment funds were cut by almost half due to rising interest rates and competition from other forms of investment.
Finally, personal business income grew by 10% compared to 8.2% in 2022 ( Table 2.8 ). Its profile throughout the year was, as happened with other variables linked to SMEs, one of deceleration after a good start to the year inherited from the good results that characterized the entire previous year.
The consolidated tax base of Corporate Tax grew by 19.5% ( Table 3.1 ). It is worth noting that this high rate is recorded after two years of strong increases (36% in 2021 and 18.7% in 2022). Corporate profits increased by more than 10% in 2023. In the case of Large Companies and groups, the profits declared in their third advance payment submitted in December grew by 15.4% ( Table 3.2 ), with the increase being greater in Large Companies (17%) than in groups (14.3%). Growth was very high in the first months of the year, especially in the groups (and, in particular, in the energy and financial sectors), it moderated in the middle part of the year, which was also compared with very good results from the previous year, and it recovered in the final part of the year.
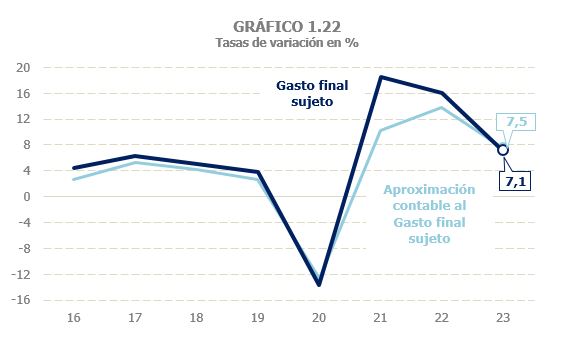
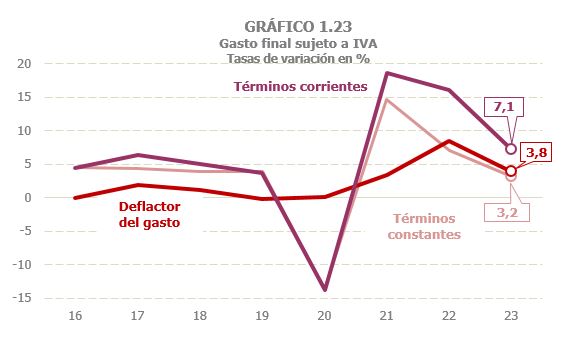
He final expenditure subject to VAT grew by 7.1% in 2023, almost nine points below the increase achieved a year earlier (Table 4.1). For the accounting approximation to the final subject expenditure, a similar increase is estimated (7.5%), although the sign of deceleration is smaller in this case, due to the already mentioned discrepancy that has been observed between the bases and their accounting indicators in the period 2021-2022 and which has represented an anomaly in the history of both series (Chart 1.22). Spending growth in 2022 was clearly affected by the inflationary cycle that began in mid-2021 and by the fact that tourism spending was still recovering in 2022 compared to pre-pandemic levels. Both factors help to explain part of the slowdown in 2023, although this is also evident, although less intense, in the evolution of spending in constant terms, which goes from growing 7% in 2022 to 3.2% in 2023 (Chart 1.23). By component, all of them (household spending, new home purchases, public administration consumption) registered rates lower than those of the previous year, although the component that suffered the greatest slowdown was household spending.
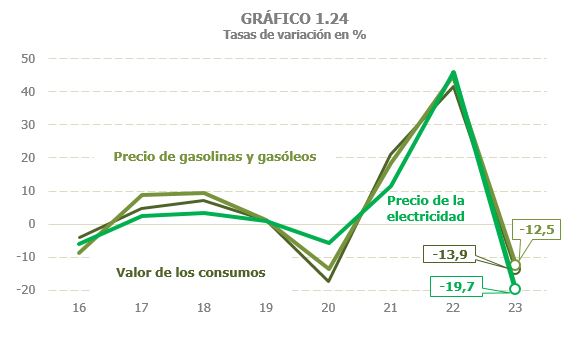
The value of consumption subject to Excise Taxes was reduced by 13.9% in 2023 ( Table 1.3 ). The main reason for this decline is the fall in value in the two components with the greatest weight in the total, that is, hydrocarbons and electricity, a consequence in turn of the sharp reduction in their prices after the high levels reached the previous year ( Tables 5.7 and 9.1 and Chart 1.24). To this factor we must add the drop in consumption. The value of alcohol and intermediate products consumed fell slightly despite the price increase, as this led to a drop in consumption. Finally, the value of beer and tobacco consumption increased, driven by a pre-tax price increase of 13% and 10.6% respectively ( Table 9.2 ), while consumption remained almost constant in the case of beer and decreased in the case of tobacco.