Employment and wages in the statistics of the Tax Agency
Last Tuesday, November 14, the statistic Labor Market and Pensions in Tax Sources corresponding to the year 2022 was published. This statistic exploits the information on salaries and pensions contained in declaration model 190 of withholdings on income from work and economic activities, which must be presented by all entities that pay, among others, these incomes. The annual declaration basically consists of a list of people with the income they receive, the withholdings made and the personal characteristics necessary for calculating these withholdings. All this information provides a single source for studying employment and, in particular, wages in the territory with a common tax regime.
Apart from this statistic, the exploitation of model 190 feeds other publications of the Agency itself (Labor market mobility in tax sources, Historical series of bases, rates and taxes accrued) and statistical operations of other organizations in collaboration with the Agency (Urban Indicators, Atlas household income distribution, household panel, Continuous Sample of Working Lives).
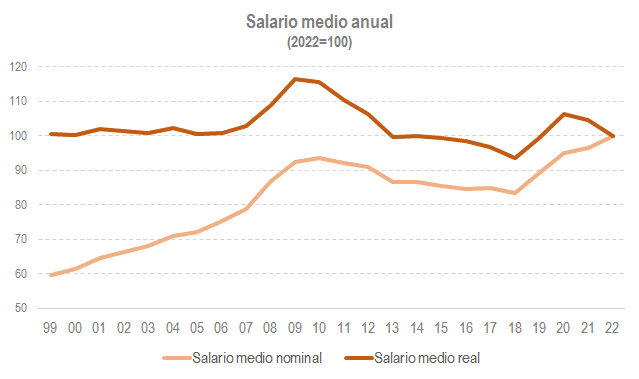
There are publications of the statistic Labor Market and Pensions in Tax Sources since 1999, which, linked to the series published in the nineties by the Institute of Fiscal Studies (precursor of this type of analysis), could be extended until 1992. The following graph summarizes the main result of the statistics, the average salary, both in current euros (the figure that can be obtained directly from the statistics published on the Agency's website), and in terms of purchasing power capacity (the nominal salary divided by the IPC).
The great advantage of having a source such as model 190 is that not only can an aggregate measure of salaries be analysed as above, but it also allows for a maximum level of detail. At the same time as the statistics are published, file Salary distribution is updated. As its name indicates, it contains the distribution of salaries by ranges since 2001. The following graph is an example of what can be found in it.
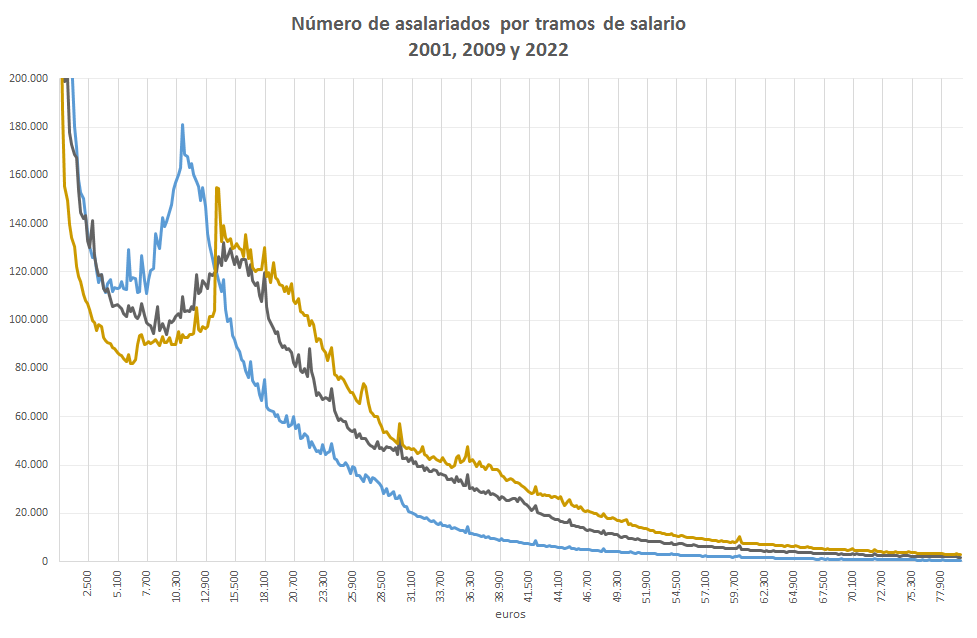
Three years have been selected for the graph: the initial one (2001, in blue), the moment in which the maximum real salary is reached (2009, in grey) and the last available period (2022, in gold). The chart shows the first 399 salary brackets (data is given in 200 euro brackets, 400 brackets until 2021 and 1,000 from 2022).
Several aspects stand out in this graph. First of all, one that is one of the main features of these distributions: the high accumulation of people in the first sections. This is explained because the model includes the salaries that have been received in the year regardless of the time worked; That is, it includes numerous people who, due to various circumstances, have not worked the full year (a correction for this effect can be found in annex Full year salary module of the statistics themselves). Secondly, we can see the progressive shift to the right of the distribution, typical of nominal variables (see in the first graph the growth of the average nominal salary between the three selected years). Thirdly, the granularity of the underlying information means that some peaks can be observed at certain salary levels, which are usually related to regulations (for example, salaries linked to certain professional categories). In this regard, the two jumps that occur in the 2022 distribution around the interprofessional minimum wage, in its full-time and part-time modalities, are particularly noteworthy.