Where is the minimum wage listed in tax statistics?
All individual information on salaries available to the Tax Agency comes from the annual informative declaration of withholdings on work and economic activity income (form 190), which employers must submit, regardless of the number of employees, their salaries, their withholdings or the period of the year in which they have been employed.
The statistical exploitation of these data is the responsibility of the publication Labour market and pensions in tax sources . In a previous entry of this newsletter ( Tax Agency: Employment and wages in the statistics of the Tax Agency ) other products that revolve around this model and the operations of other organizations that benefit from this information were detailed.
One of the advantages that was highlighted at that time was the possibility of going down to the maximum level of detail or, in other words, although the statistics mentioned have an aggregate character, they are constructed from the bottom up, from the individual data of the people who have received the salaries. This allows for salary distributions with maximum granularity. These distributions (in 200 euro increments) can be found, since 2001, in file Salary distribution which contains information on the number of employees, salaries and withholdings made. The latest available version, for 2022, is shown in the following graph.

The feature that is worth highlighting in this note is the detail with which the distribution is presented, unattainable in other statistical approaches on the subject, which allows for the analysis of certain relevant points, such as the ranges around the minimum interprofessional wage (SMI). If you zoom in on that area for the last few years, you would have the following graph showing the current annual SMI for each year:
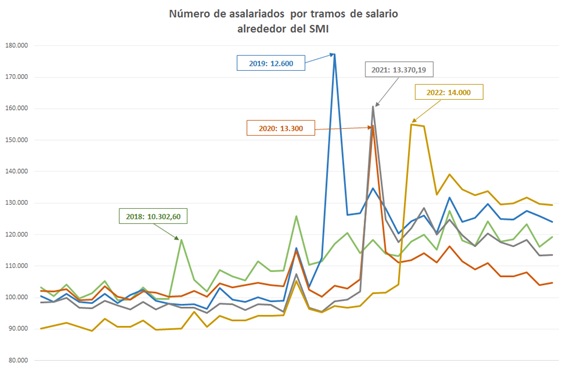
It should be noted, however, that for several reasons this is only a proxy for the true number of minimum wage earners. Firstly, there is no mark on Model 190 that allows these workers to be accurately identified. Secondly, what is being shown in the graph is the annual full-time SMI; If the working day is not full-time, it is more difficult to determine where these workers are (although, as can be seen in the first graph with the full distribution, there is another jump at the level of 7,100 euros which can also be attributed to the SMI, in this case for half of the full working day). And thirdly, workers with the SMI may have additional benefits (night work, danger work, etc.) that mean that they appear to the right of the SMI in the distribution.
Just as interesting as the salary distribution is the effective retention rate curve, also accessible in the file cited above. The following graph shows this curve for recent years:
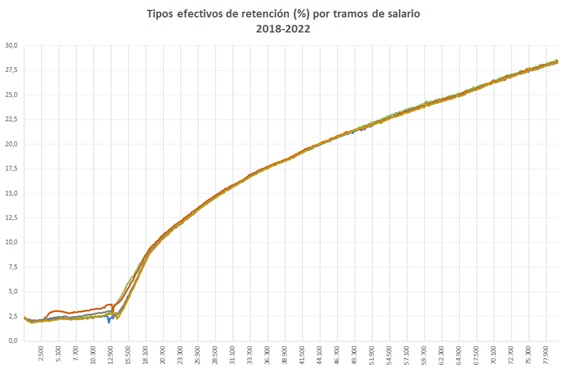
As can be seen, the changes in recent years are concentrated in lower wages, around the SMI, which is where the successive changes in the regulation of the general reduction in work performance have had an effect. If these sections are isolated, as is done in the following graph, the reduction in rates for this group can be seen more clearly:
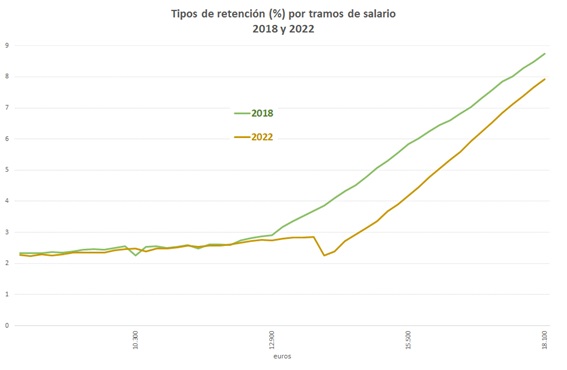
Finally, it should be noted that this is an effective rate curve, which explains the small irregularities that occur and, above all, the fact that the rate does not become zero in salary brackets where, for the majority of workers, the deductions are low. In this regard, two issues must be remembered: One, that in these sections there are also workers who have not worked the entire year and that, therefore, the salary recorded in form 190 does not correspond to an annual salary and they may have withholdings greater than zero; and, two, that there is a minimum retention rate equal to 2% for those contracts lasting less than a year, which prevents the improvements in the reduction from being passed on to workers in that situation.