The end of 2023 in the latest published tax statistics
Recently published tax statistics allow us to begin to have a complete overview of what 2023 was like. In the last month, the data for December on sales, employment and wages of Large Companies and foreign trade have been known, as well as the data for the fourth quarter on sales, employment and wages of Large Companies and of corporate SMEs . The latter also close the year for the Business Margins Observatory . Likewise, the annual information has been completed in the Statistics on the Registration Tax of Motor Vehicles . The information on December's revenue collection is still pending, and will be published, as usual, at the end of March.
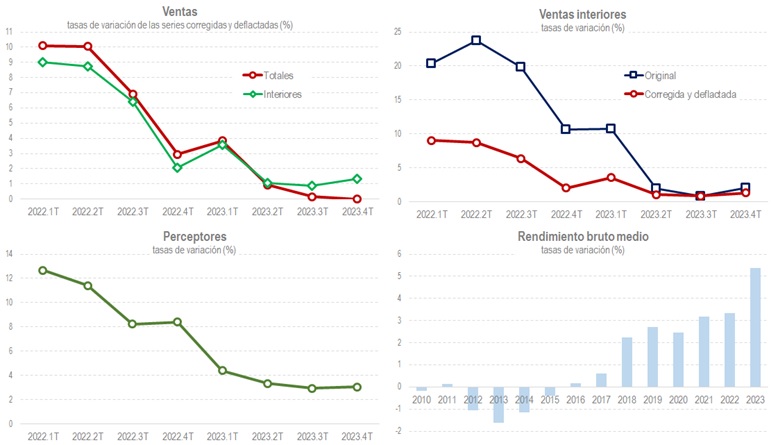
The basic features that characterized evolution of sales, employment and wages in large companies and corporate SMEs, the fiscal indicators with the greatest coverage, were : the moderation in the pace of sales growth; the different performance of exports (with a poor second half of the year) and domestic sales (which have picked up in recent months); the lowest price increase; the robust and stable growth of employment, although at rates lower than those of 2022, which reflected the comparison with 2021, which had not yet reached full normality in some activities; and the increase in average wages above 5%, a delayed and incomplete consequence of the price increases of previous years. These five elements are summarized in the following graphs:
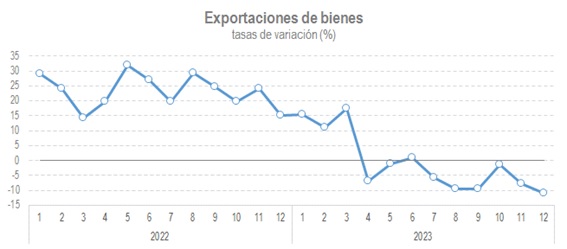
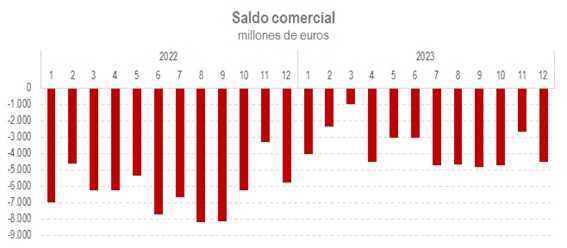
The deterioration of exports throughout the year can be analyzed in more detail by referring to the Foreign trade statistics . The graphs below plot the trajectory of goods exports and the trade balance. It can be seen that exports entered negative territory starting in April. Since imports also fell from that date, the trade balance managed to remain relatively stable for much of the year, improving on the results recorded in 2022.
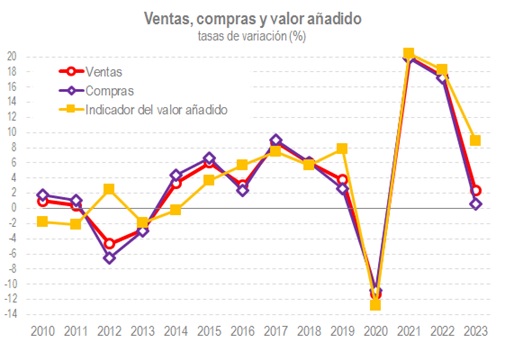
The slowdown in sales growth in 2023, which has been cited as one of the hallmarks of the year, may lead to a more negative interpretation of the year's economic situation than expected if the development of purchases is not taken into account at the same time. The data accompanying the reports on Large Companies and Corporate SMEs offer this information, which can also be found, for a somewhat smaller group of companies, in the Business Margins Observatory . The following graph shows the relationship between sales and purchases and their difference, the added value indicator. As can be seen, the meager growth in sales was compatible with an increase in added value of over 8%, thanks to the virtual stabilisation of purchases.
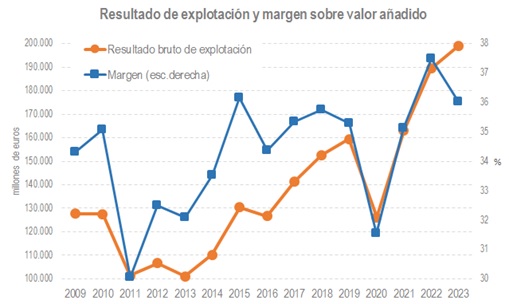
It was precisely this strong increase in added value that made it possible for gross operating profit to continue to grow despite wage increases and job creation. According to the information collected by the Observatory, and projecting the profit and loss account to 2023 with the results of VAT and labor withholdings, the gross operating profit of non-financial companies would have grown by more than 5% and the margin with respect to added value would have been at its highest level since 2009 in the last two years. The following graph illustrates this evolution:
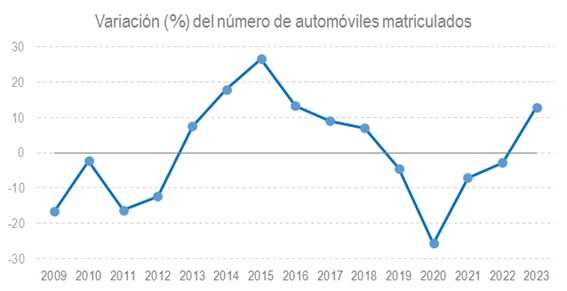
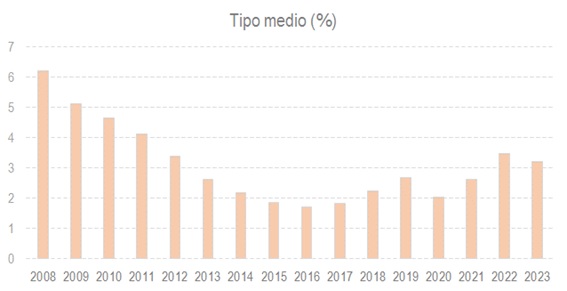
Finally, it is worth mentioning the publication of the 2023 annual data of the Statistics on the tax on motor vehicle registration . The final data for the year, which was released in advance, indicates that the number of registrations grew by 12.9%, the highest figure since 2016, and that the average rate stopped rising since the minimum that year.